In this article, we will see how we can integrate an Azure data source with Graphite and Grafana. This will allow us to monitor metrics from the applications hosted in the Azure cloud on a Grafana dashboard. We will also see how to integrate Azure Active Directory with MetricFire’s Hosted Graphite and Grafana. You don’t need fully functional cloud services running with Azure to understand this article, but it assumes that you have basic familiarity with Azure Cloud.
Network traffic monitoring has become critical in today's digital age, where businesses rely on various applications and services to operate. As the amount of data transmitted over networks continues to grow exponentially, network administrators must keep a close eye on the traffic to ensure optimal network performance and security. Network administrators must have a deep understanding of packet flows, collection methods, and analytics to ensure that their networks are secure and performing optimally.
In this livestream, Jackie McGuire and I discuss the harmful effects of data debt on observability and security teams. Data debt is a pervasive problem that increases costs and produces poor results across observability and security. Simply put — garbage in equals garbage out. We delve into what data debt is and some long term solutions. You can also subscribe to Cribl’s podcast to listen on the go!
The Cribl team just wrapped up the 2023 AWS Summit in Washington, DC, and we were thrilled to spend a few days chatting with public sector organizations looking to gain the freedom and flexibility our products offer.
They say imitation is the sincerest form of flattery. In the six years since we launched the initial SRE report, we've seen some similarly themed 'reports' jump on the state of site reliability bandwagon. Why? Because the impact and importance of SRE and resilience engineering have resonated across industries, prompting organizations to delve deeper into this vital domain.
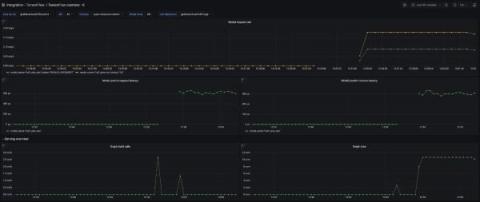
The world of AI and machine learning has evolved at an accelerated pace these past few years, and the advent of ChatGPT, DALL-E, and Stable Diffusion has brought a lot of additional attention to the topic. Being aware of this, Grafana Labs prepared an integration for monitoring one of the most used machine learning model servers available: TensorFlow Serving. TensorFlow Serving is an open source, flexible serving system built to support the use of machine learning models at scale.
Grafana Cloud, our composable observability platform, is billed based on usage. A common question we get is: “How much will it cost to monitor N servers?” Well, the recently expanded Grafana Cloud Free tier includes up to 10,000 active series. To help you understand what that translates to in terms of time series requirements, here’s a rough guide to estimating what you’ll need.