With the increasing reliance on technology in all aspects of business, managing and maintaining IT hardware is a critical task. An effective IT hardware inventory management system can help organizations to improve their productivity, reduce costs, and minimize downtime due to hardware failure.
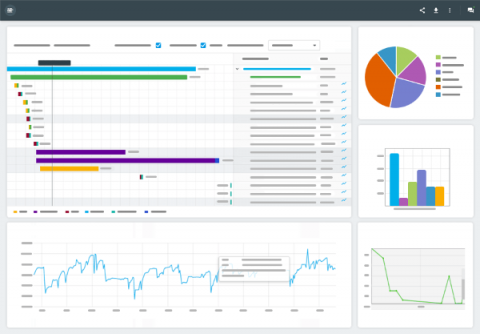
Grafana is a powerful open-source visualization solution that provides valuable insights into the performance of infrastructure, applications, and servers. With customizable visualizations and support for diverse data sources and formats, Grafana allows IT teams to collect and visualize data from various sources.
In the realm of virtualization, snapshots play an integral role in managing virtual machines (VMs). Essentially, a snapshot captures the state of a VM at a specific point in time, providing a reference point to which you can revert if necessary. This can be especially handy when implementing changes to your VM or its applications, allowing you to quickly undo the changes if they cause any unforeseen issues.
In this article, we will deploy a clustered Prometheus setup that integrates Thanos. It is resilient against node failures and ensures appropriate data archiving. The setup is also scalable. It can span multiple Kubernetes clusters under the same monitoring umbrella. Finally, we will visualize and monitor all our data in accessible and beautiful Grafana dashboards.