Take it from ServiceNow's founders: creating technology for the sole purpose of making other people's lives better is the most fulfilling thing you can do.
The end-to-end monitoring of complex software systems is difficult, toil-intensive and error-prone. Developers, SREs and Platform teams must continuously invest effort in setting up and maintaining the monitoring setups that underpin the observability of their systems, or accept the risk of being unaware of ongoing issues and their impact on end users. Enter model-driven observability powered by Juju!
A central theme in digital strategies today is AI and figuring out how to integrate AI with existing IT service management efforts. In this webinar, you will learn how AI-based products and services can be incorporated into your current ITSM and ESM efforts.
"How does Civo compare to other cloud providers you have used?" Learn how to Pyroscope team works faster with Civo Kubernetes in this talk we had with Ryan, co-founder of Pyroscope.
Join Robert Sirchia and Matt Farina for Rancher Desktop's GA Go Live. These two will be live as Matt and team publishes the release of Rancher Desktop 1.0.
In a customer-centric world, observability is mission-critical for delivering great digital experiences. Join the "The Future of Observability" panel discussion to learn: What drivers create the need for observability What steps you should take to reach your observability goals What elements are necessary for an effective observability strategy What the future of observability looks like Panelist: Mitch Ashley - Techstrong Research Lodewijk Bogaards - StackState Brian Dawson - Dawson and Dawson, Inc. Cyrille Le Clerc - Elastic
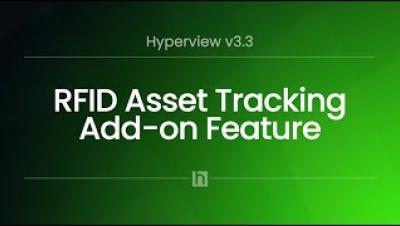
Track and audit assets at the U rack level in real-time with our new add-on feature, AssetTracker RFID. Plus, a beta version of the Data Collector for Linux is now available for download.
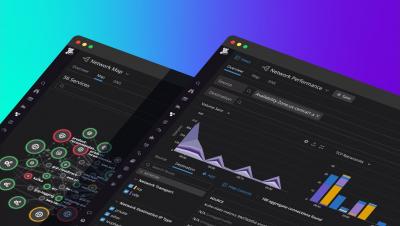
Datadog Network Performance Monitoring (NPM) provides end-to-end visibility into on-prem, cloud, and hybrid networks. With NPM, teams can monitor communication between services, pods, availability zones, and any two meaningful endpoints to quickly determine if the network is responsible for an issue.
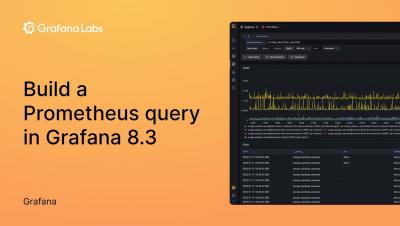
Connect Grafana and Prometheus in less than 60 seconds! We show you how to add a Prometheus data source to your Grafana instance and how to customize settings such as authentication details and scrape intervals.