Operations | Monitoring | ITSM | DevOps | Cloud

Logging

The latest News and Information on Log Management, Log Analytics and related technologies.

Announcing the RemoteWrite SDK for Custom Metrics in Python, Go & More

We’re proud to announce the creation of a new RemoteWrite SDK to support custom metrics from applications using Golang (Go), Python, and Java, with many more on the way. Each SDK will have automatic, continuous deployment of updates. Using these integrations, Prometheus users can send metrics directly to Logz.io using the RemoteWrite protocol without sending them to Prometheus first.

Prioritize and resolve performance defects with Splunk Web Optimization

Find, fix and prevent web performance issues with an intelligent optimization engine. From Google's Lighthouse scores to core web vitals and 50+ modern performance metrics, learn to benchmark and improve page performance and user-experience with Splunk Web Optimization. Get a free trial as part of Splunk Synthetic Monitoring today.

Optimize Value of Cloudtrail Logs With Infrequent Tier

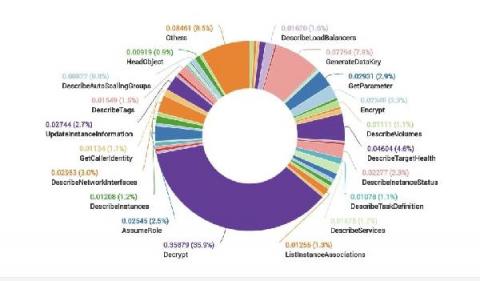
A common scenario for log analytics is that many log events are high value for real time analytics, but there are also events that are low value for analytics, but account for a very large percentage of overall log volume. Often these same low value logs are used only for ad-hoc investigations from time to time or need to be retained for audit purposes.

Understanding IIS Log Files: Operating Instructions

Commonly, your website or app functions perfectly until you release it. During testing, you might seem to have control over everything. But, sooner or later, you will face some challenges. In fact, it is totally normal when something goes wrong. The most important thing is how you settle these problems. In most cases, issues with availability alerts and users’ complaints can be addressed by the means of IIS logs. IIS logging will provide you with the necessary data to deal with a breakdown.

Apache Monitoring: Best Tools and Key Metrics to Track Web Server Performance

The Apache HTTP Server (httpd) is a widely used, open-source web server application. Because you can easily customize it through modules, it has become the go-to choice of both individuals powering their personal blogs and enterprises running high-traffic websites and web apps. It’s a well-known fact that with high traffic, the performance of Apache web servers can take a hit, experiencing bottlenecks as your traffic scales up, which will lead to delayed responses.

How to mitigate DevOps tool sprawl in enterprise organizations

There’s an insidious disease increasingly afflicting DevOps teams. It begins innocuously. A team member suggests adding a new logging tool. The senior dev decides to upgrade the tooling. Then it bites. You’re spending more time navigating between windows than writing code. You’re scared to make an upgrade because it might break the toolchain. The disease is tool sprawl.

Dissecting DevOps - Measuring quality in a SaaS world: SLA, SLI, SLO

Now that software is delivered over the web and not in a box, how developers guarantee quality to their users has radically changed. Users do not care about version numbers or floppy disks. They just want access to a service that just works. In the microservices world, the quality of your service both to your internal users and external is measured by SLAs, SLIs, and SLOs. And how you decide what those metrics are is a key strategy.

The Ops Agent is now GA and it leverages OpenTelemetry

Running and troubleshooting production services requires deep visibility into your applications and infrastructure. While basic logs and metrics are available out of the box with Google Cloud Compute Engine (GCE), capturing advanced data used to require the installation of both a metrics agent and a logging agent.