Operations | Monitoring | ITSM | DevOps | Cloud

Logging

The latest News and Information on Log Management, Log Analytics and related technologies.

The Top 21 Grafana Dashboards & Visualisations

In our guide on the best Grafana dashboards examples, we wanted to show you some of the best ways you can use Grafana for a variety of different use cases across your organisation. Whether you are a software architect or a lead DevOps engineer, Grafana is used to make analysis and data visualisation far easier to conduct for busy engineering and technical teams throughout the world.

How Log Analytics Powers Cloud Operations, Part II: Use Cases

Cloud computing shapes the ability of enterprises to transform themselves and compete in the 2020s. By renting elastic cloud resources, enterprises can support new customer platforms, distributed workforces, and back-office operations. The cross-functional discipline of CloudOps helps enterprises realize the promise of cloud computing by optimizing applications and infrastructure on cloud platforms.

Announcing the GA of the LogDNA Configuration API and LogDNA Terraform Provider

We’re excited to announce that our Configuration API and Terraform Provider are now generally available for all LogDNA customers. We received tremendous feedback from our public beta release and, based on that feedback, we are enabling several new features with the GA release that allow for more programmatic workflows with LogDNA. First, we are enabling Preset Alerts as a new resource that can be configured with the configuration API as well as within Terraform.

NiCE Log File Monitor Management Pack 2.0 for Microsoft SCOM

The NiCE Log File Monitor Management Pack 2.0 is a FREE solution supporting the SCOM Community in next-level log file analysis. It helps IT performance and security data analysts identify errors causing transactions and queries to take too long or not run at all. Software-related bugs, security issues, or erroneous configurations that impact website or application performance are figured out quickly by employing improved templates for alert rules, performance rules, or monitors.

Logz.io Delivers Cloud Native Monitoring to the Azure Marketplace

Logz.io is proud to launch a new partnership with Microsoft that enables Azure customers to directly integrate with Logz.io’s platform from within the Azure Console. This integration importantly allows Azure developers to begin monitoring their workloads faster than ever before, using the open-source technologies that their teams love. Check out this video for a demonstration of how it works.

Integrating Logz.io with Azure

Azure users can now deploy the Logz.io platform directly from the Azure Console with the click of a button. The seamless integration between Azure and Logz.io delivers visibility and monitoring for enterprise organizations developing applications on Azure, providing the specific information needed to streamline code development and achieve business agility.

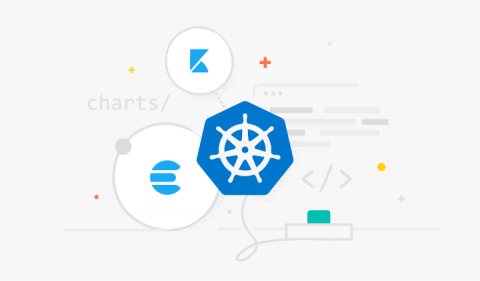
Monitoring Kubernetes the Elastic way using Filebeat and Metricbeat

In my previous blog post, I demonstrated how to use Prometheus and Fluentd with the Elastic Stack to monitor Kubernetes. That’s a good option if you’re already using those open source-based monitoring tools in your organization. But, if you’re new to Kubernetes monitoring, or want to take full advantage of Elastic Observability, there is an easier and more comprehensive way. In this blog, we will explore how to monitor Kubernetes the Elastic way: using Filebeat and Metricbeat.

How to monitor Cassandra database clusters

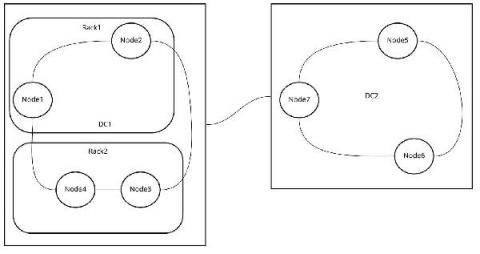
Apache Cassandra is an open-source distributed NoSQL database management system that was released by Facebook almost 12 years ago. It’s designed to handle vast amounts of data, with high availability and no single point of failure. It is a wide-column store, meaning that it organizes related facts into columns. Columns are grouped into “column families.” The benefit is that you can manage data that just won’t fit on one computer.