Operations | Monitoring | ITSM | DevOps | Cloud

Logging

The latest News and Information on Log Management, Log Analytics and related technologies.

Developer's Dilemma: When Is the Right Time to Invest in Log Management

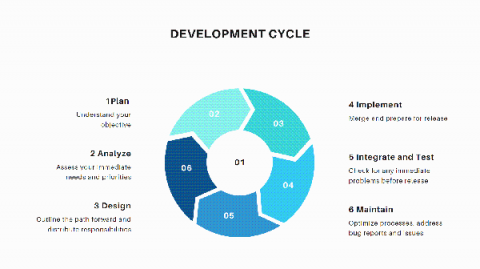
Development cycles are complicated. If you’re on a development team, whether you’re building out a custom application, maintaining and iterating on a growing microservice, or breaking ground on a new platform for a startup, you have your hands full. Log management, though seldom celebrated outside hardcore DevOps and IT circles, is still a well-known instrument among seasoned developers. It is insight into the internal workings of your processes as they are used.

JavaScript Logging Basic Tips

In the past few years, JavaScript has evolved in several ways and has come a long way. With the evolving technology, machines are becoming more powerful, and browsers are getting more robust and compatible. In addition, Node.js’s recent development for JavaScript’s execution on servers, JavaScript has been getting more and more popular than ever before.

5 Key Considerations When Choosing a Log Management Solution

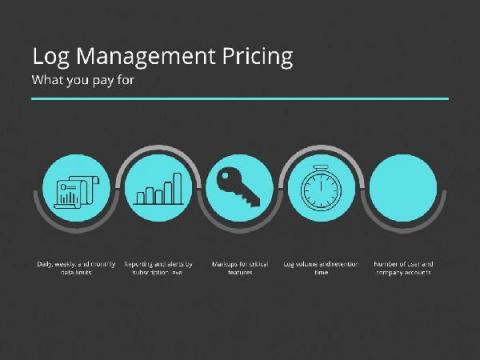
Purchase decisions often begin with a price check. Log management is no different. Evaluate your budget and narrow down the options that fit to choose the tool that gives you the most for what you pay. As always, cheaper is better as long as the platform doesn’t cut any corners. But with log management, there is a catch – not all tools are transparent with their pricing model.

The Benefits of Centralized Log Management and Analysis

Log centralization is kind of like brushing your teeth: everyone tells you to do it. But until you step back and think about it, you might not appreciate why doing it is so important. If you’ve ever wondered why, exactly, teams benefit from centralized logging and analysis, keep reading. This article walks through five key advantages of log centralization for IT teams and the businesses they support.

How to Notify Your Team of Errors: Email vs. Slack vs. PagerDuty

Site Reliability Engineering (SRE) and Operations (Ops) teams heavily rely on notifications. We use them to know what’s going on with application workloads and how applications are performing. Notifications are critical to ensuring SREs and Ops teams can resolve errors and reduce downtime. They’re also crucial when monitoring environments — not only when running in production but also during the dev-test or staging phase.

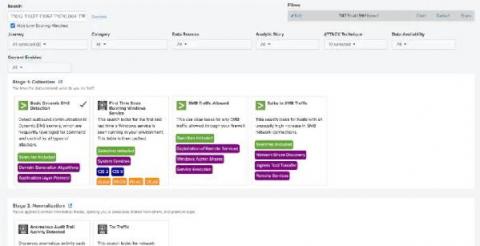
Get Started with Splunk for Security: Splunk Security Essentials

Continuing to ride the waves of Summer of Security and the launch of Splunk Security Cloud, Splunk Security Essentials is now part of the Splunk security portfolio and fully supported with an active Splunk Cloud or Splunk Enterprise license. No matter how you choose to deploy Splunk, you can apply prescriptive guidance and deploy pre-built detections from Splunk Security Essentials to Splunk Enterprise, Splunk Cloud Platform, Splunk SIEM and Splunk SOAR solutions.

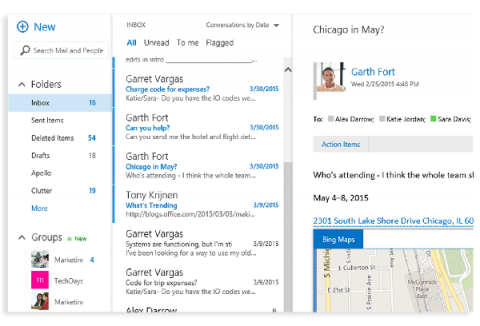
Analyzing Office 365 GCC Data With Sumo Logic

Many of our customers today leverage Office 365 GCC High, including organizations looking to meet evolving requirements for working with the United States Department of Defense. Sumo Logic enables customers to leverage our out-of-the-box monitoring and analytics capabilities to analyze Office 365 GCC High data to offer security engineers and security analysts stronger situational awareness of internal employee data.

Introduction to Custom Metrics in Python with the Logz.io RemoteWrite SDK

We just announced the creation of a new RemoteWrite SDK to support custom metrics from applications using several different languages. This tutorial will give a quick rundown of how to use the Python SDK. Using these integrations, Prometheus users can send metrics directly to Logz.io using the RemoteWrite protocol without sending them to Prometheus first. Each SDK, while for a separate language, is each capable of working with frameworks like Thanos, Cortex, and of course M3DB.