Operations | Monitoring | ITSM | DevOps | Cloud

Logging

The latest News and Information on Log Management, Log Analytics and related technologies.

Elastic recognized for innovation by Google Cloud and Microsoft

Elastic received honors from two key partners, Microsoft and Google — a recognition of our efforts to ensure that customers can easily find and use Elastic products in the environments that best suit their needs. Elastic was named the 2021 Microsoft US Partner Award Winner in Business Excellence in the Commercial Marketplace. In addition, for the second year in a row, Elastic was selected by Google Cloud as the 2020 Technology Partner of the Year for Data Management.

How to Monitor Redis Logs and Metrics

With a multitude of digital options available in almost every industry, it’s become increasingly critical that applications and services provide a positive user experience. Doing so requires a high level of availability, made possible (in part) by efficiently identifying and resolving issues with the system, when they occur. To achieve this, monitoring all critical components of an application and its infrastructure is a necessity.

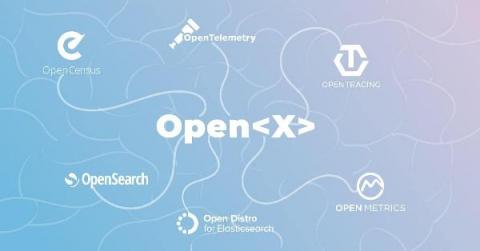
Quick Dictionary to Open<X> Projects in Observability

Do you also find yourself confused by all the Open-this and Open-that names flying around? There are currently a good few Open projects, standards, tools – OpenTelemetry, OpenTracing, OpenCensus, OpenSearch… heck, even my podcast is called OpenObservability! And new Open names seem to be popping up every other day. If you too feel this way, there’s no need. Many feel similarly confused.

What's new in Grafana Enterprise Logs 1.1: Label-based access control

Back in February, we introduced Grafana Enterprise Logs (GEL) into the Grafana Enterprise Stack. GEL is a new way for large organizations to ingest and query their full log volume, without the cost or operational complexity associated with other solutions. (View a demo here.) We just released GEL 1.1, and one of its key features is label-based access control (LBAC).

Logging, Monitoring, and Debugging in Kubernetes

No matter what you’re using Kubernetes for, visibility into your applications’ performance and activity is a beneficial and often essential undertaking – essential, but colossal, requiring entire teams dedicated to nothing but maintaining deployments, auditing, debugging, and keeping up with compliance. Kubernetes has robust support documentation dedicated exclusively to assisting customers with Monitoring, Logging, and Debugging.

Elastic Agent and Fleet make it easier to integrate your systems with Elastic

Today, we are happy to announce three major improvements that will make it easier to integrate your systems and applications with the Elastic Stack. First, we are launching the generally available (GA) release of our Elastic Agent, which is a single, unified agent for both observability and security. A unified agent will simplify data onboarding with fewer things to configure and install.

Elastic 7.14.0 introduces the industry's first free and open Limitless XDR

We are pleased to announce the general availability (GA) of Elastic 7.14, including our Elastic Enterprise Search, Observability, and Security solutions, which are built into the Elastic Stack — Elasticsearch and Kibana. Elastic 7.14 empowers organizations with the first free and open Limitless XDR, which delivers unified SIEM and endpoint security capabilities in one platform.

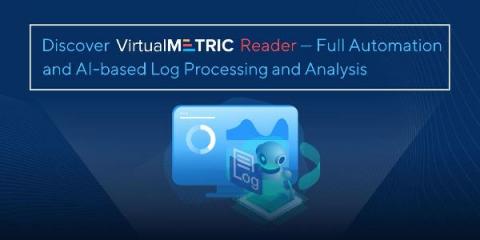
Discover VirtualMetric Reader - Full Automation and AI-based Log Processing and Analysis

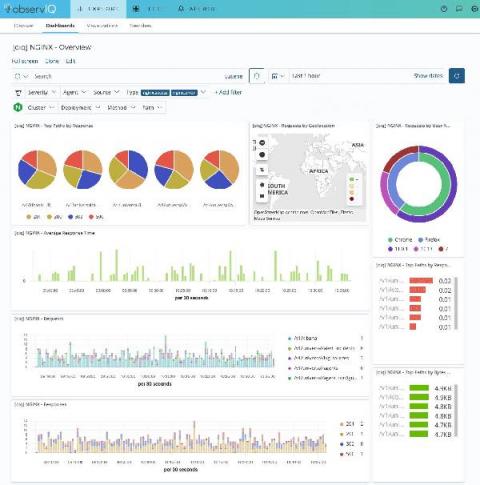
VirtualMetric presents a new feature as part of our Log Tracking Suite – VirtualMetric Log Reader. The new capability of the product connects to any device within your IT infrastructure, collects the log information, parses it and transforms it into easy to analyse charts and graphs. No need to add any data sources or to read logs manually.

Logit.io Confirms Plans To Support AWS OpenSearch & OpenDashboards

We are excited to inform all of our users that we will be bringing OpenSearch and OpenDashboards onto the Logit.io platform in the coming months. You may have already been aware that we’ve previously announced our support for the previous iteration of OpenSearch & OpenDashboards known as Open Distro in our response here. Due to our early public support of these oncoming changes you can see our platform cited on the official AWS OpenSearch website.

What Is Network Latency: Complete Guide on How to Check, Measure and Reduce It to Improve Performance

So you finally launched your service worldwide, great! The next thing you’ll see is thousands and thousands of people flooding into your amazing website from all corners of the world expecting to have the same experience regardless of their location. Here is where things get tricky. Having an infrastructure that will support the expansion of your service across the globe without sacrificing user experience is going to be real though as distance will introduce latency.