Operations | Monitoring | ITSM | DevOps | Cloud

Logging

The latest News and Information on Log Management, Log Analytics and related technologies.

How to configure Elastic Cloud on Kubernetes with SAML and hot-warm-cold architecture

Elastic Cloud on Kubernetes (ECK) is an easy way to get the Elastic Stack up and running on top of Kubernetes. That’s because ECK automates the deployment, provisioning, management, and setup of Elasticsearch, Kibana, Beats, and more. As logging and metric data — or time series data — has a predictable lifespan, you can use hot, warm, and cold architecture to easily manage your data over time as it ages and becomes less relevant.

What the Fastly Outage Can Teach Us About Observability

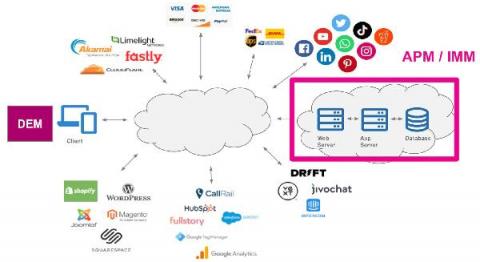
On Tuesday June 8th, the Content Delivery Network Fastly experienced an outage that made large swaths of the web unavailable for nearly an hour. To focus on the positive, this outage can serve as a wakeup call for Observability teams, because it shows how much modern sites depend on resources beyond their immediate control, and how hard it is to "observe" these kinds of issues with an incomplete Observability mindset.

Key JVM Metrics to Monitor for Peak Java Application Performance

Monitoring is crucial if you want to see what happens in your system and JVM-based applications are not different. Well, some metrics, like memory and garbage collection, require special attention because they play a major role in your application performance. In this blog post, we will look into the key Java Virtual Machine (JVM) metrics that you should monitor if you care about performance and stability. Those are the memory, the garbage collection, and the JVM threads.

Multi-Project Cloud Monitoring made easier

Customers need scale and flexibility from their cloud and this extends into supporting services such as monitoring and logging. Google Cloud’s Monitoring and Logging observability services are built on the same platforms used by all of Google that handle over 16 million metrics queries per second, 2.5 exabytes of logs per month, and over 14 quadrillion metric points on disk, as of 2020.

Splunk Connector for Ivanti Device Control - Now Available!

Ivanti Device Control is all about securing your endpoints while also providing a detailed overview to quickly identify weak links in your environment. The latter has now become much simpler and quicker to perform! Our new Splunk connector enables you to connect directly to your Ivanti Device Control environment, feeding in all reported events and showing you the most important data in a single dashboard.

How to Monitor Application Logs

In the beginning, there was the Log – or to be a bit more precise, there were application logs. At least that's how it was in the early days of application development, when raw log data itself was more often than not the point where troubleshooting began. Now, of course, the starting point for troubleshooting with cloud-based applications is much more likely to be an automatically-generated alert, or an indication on a monitoring dashboard that something isn't quite right.