Operations | Monitoring | ITSM | DevOps | Cloud
Monitoring
The latest News and Information on Monitoring for Websites, Applications, APIs, Infrastructure, and other technologies.
Hardening against future S3 outages
On February 28, 2017, Amazon S3 in the us-east-1 region suffered an outage for several hours, impacting huge swaths of the internet. StatusGator was impacted, though I was able to mitigate some of the more serious effects pretty quickly and StatusGator remained up and running, reporting status page changes through the event. Since StatusGator is a destination for people when the internet goes dark, I aim to keep keep it stable during these events.
The End-User Experience Enigma: The Continuing Performance Puzzle Saga in Citrix Environments
With over 400K customers, Citrix is defining the digital workspace that securely delivers Windows, Linux, web, SaaS apps, and full virtual desktops to any device, anywhere. Citrix administrators at all these customers are the frontline for addressing dissatisfied end users of those applications and desktops. Unfortunately, even today, understanding real end-user experience in Citrix environments remains an unsolved puzzle.
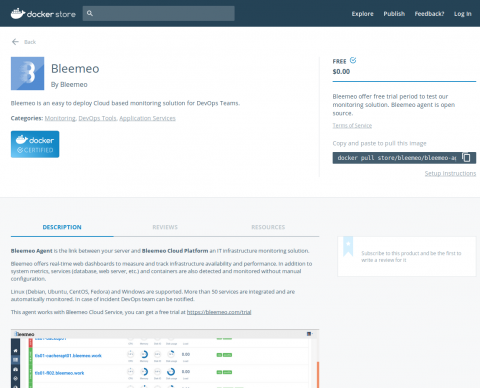
Bleemeo Joins the Docker Certification Program
We are happy to announce today that Bleemeo's smart agent has been accepted into the Docker Certification Program, a framework for partners to integrate and certify their technology to the Docker Enterprise Edition (EE) commercial platform. Starting today, Bleemeo's smart agent is now listed on the Docker Store as a "Docker Certified Container".
Monitoring performance of your Fetch API
The fetch API allows you to make network requests similar to XMLHttpRequest (XHR). We already wrote a blog about how Fetch API are simple and yet powerful compared to XHR. Atatus now supports Fetch API monitoring out of the box. You don’t need any special configuration to measure performances of the Fetch API.
Free Application & Server Monitoring + New Metered Pricing
We’ve updated Instrumental’s pricing to be fully metered and we replaced our 30-day trial with an entirely free Development Plan. While Instrumental’s pricing has been usage-based for a long time, this new model eliminates our plans and minimum spend requirements. With no minimum monthly spend, Instrumental is now a much better fit for smaller projects.
Amazon Kinesis: the best event queue you're not using
Instrumental receives a lot of raw data, upwards of 1,000,000 metrics per second. Because of this, we’ve always used an event queue to aggregate the data before we permanently store it. Before switching to AWS Kinesis, this aggregation was based on many processes writing to AWS Simple Queue Service (SQS) with a one-at-a-time reader that would aggregate data, then push it into another SQS queue, where multiple readers would store the data in MongoDB.
FOSDEM 2017, Monitoring and Cloud, recap
Last week-end, we were attending FOSDEM, in Brussels for one of the largest and maybe the largest open source conference over the world with about 8000 attendees from all over the world. Here is our recap.
Website Optimization For The Holiday Season
AppEnsure's Service Level Driven Advantages over Citrix Insight/Director
There has been much discussion about the new parameters that Insight/Director provide with ICA Round Trip Time (RTT). The general perception is that ICA RTT provides the end-to-end response time for applications or desktops delivered. This is NOT correct. Many times the application or VDI published will access the backend infrastructure that supports the application or VDI. The back-end infrastructure response time is not part of the ICA RTT.


