Operations | Monitoring | ITSM | DevOps | Cloud

The latest News and Information on Monitoring for Websites, Applications, APIs, Infrastructure, and other technologies.

Challenges and Solutions for Real-Time Monitoring in Mainframe MQ Systems

Mainframe MQ systems are the lifeblood of many enterprises, managing the messaging that keeps critical applications running smoothly. However, maintaining the health of these systems requires careful oversight, and this is where real-time monitoring comes into play. While real-time monitoring is essential to ensure uptime, performance, and security, implementing it in mainframe MQ systems can be filled with challenges.

Best Practices for Choosing a Status Page Provider

Downtime is inevitable but what sets successful businesses apart is how they handle it. A key part of incident management is incident communication with both internal and external stakeholders. A status page is a crucial tool for maintaining clear communication with users during outages or service interruptions. There are numerous status page providers available with different features. This article will guide you through best practices for selecting a provider that suits your needs.

Scaling Product Management for Hyper-Growth: Lessons from Cribl

Cribl has been experiencing rapid growth over the past six years as customers increasingly seek tools to modernize their data strategies. We introduced a new product, Cribl Lake, to help customers address even more diverse data management challenges. With customer data growing at a 28% CAGR, organizations are looking for solutions that can help them manage and optimize their data infrastructure.

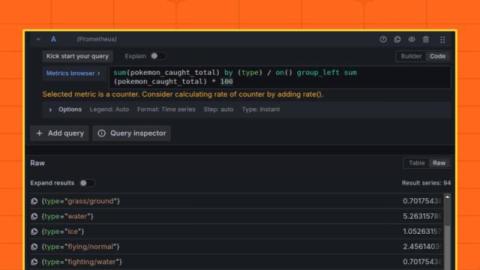
How to Join two metrics in Prometheus?

In Prometheus, metric joining allows you to merge metrics to build more detailed and insightful queries using PromQL (Prometheus Query Language). By joining metrics, you can analyse data from different sources together, providing a more comprehensive view of your system's behaviour. This metric joining capability enables you to correlate different metrics effectively, leading to better monitoring and troubleshooting.

Transform your monitoring experience-Site24x7's Custom Dashboard

The dashboard in Site24x7 provides a solid foundation, but its true potential is unlocked through customization. Custom Dashboards enable you to personalize your monitoring experience, focusing on the metrics that matter most to you. By incorporating a variety of widgets, you can create a tailored and comprehensive view of your system's performance. Site24x7’s Custom Dashboards come packed with features designed to elevate your monitoring capabilities.

Status page selector: Switch between status pages

We’re excited to announce a new feature designed for our customers with multiple boards and status pages – introducing the Status Page Selector! Now, users can switch between different status pages directly from a single page. This is especially useful for companies that need separate status pages for different products, departments, or teams.