

Streamlining Incident Investigation
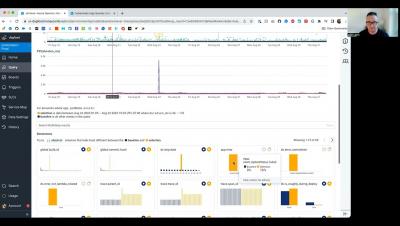
Honeycomb Customer Success Manager Josh Levin explains how to troubleshoot production incidents using Honeycomb's telemetry data: metrics, traces, and logs. While these data forms have separate interfaces, you can investigate seamlessly within Honeycomb. Josh highlights the key role of the "retriever" service in data ingestion and querying and demonstrates cross-validating tracing data with metrics to spot anomalies in pod deployments and resource usage, presented in a separate dataset. He also uses effective log filtering and searching for keywords like "update status.".


