Operations | Monitoring | ITSM | DevOps | Cloud

Observability

The latest News and Information on Observabilty for complex systems and related technologies.

Alerting on the User Experience

When your alerts cover systems owned by different teams, who should be on call? We get this question a lot when talking about SLOs. We believe that great SLOs measure things that are close to the user experience. However, it becomes difficult to set up alerting on that SLO, because in any sufficiently complex system, the SLO is going to measure the interaction between multiple services owned by different teams.

How an Observability Pipeline Can Help With Cloud Migration

Do you want to confidently move workloads to the cloud without dropping or losing data? Of course, everyone does. But easier said than done. Cloud migration is tricky. There’s so much to think through and so much to worry about — how can you reconfigure architectures and data flows to ensure parity and visibility? How do you know the data in transit is safe and secure? How can you get your job done without getting in trouble with procurement?

Honeycomb's Deployment Protection Rule for GitHub Actions

Today, GitHub announced the public beta of Deployment Protection Rules for GitHub Actions for GitHub Enterprise users. In support of that launch, we’ve partnered with GitHub to create the Honeycomb Deployment Protection Rule (available as a GitHub App). This rule lets you run Honeycomb queries so that you can get real-time performance feedback from your services before deciding whether to prevent deployment of your code to a specific environment.

Observability overload: Insights into the rise of tools, data sources, and environments in use today

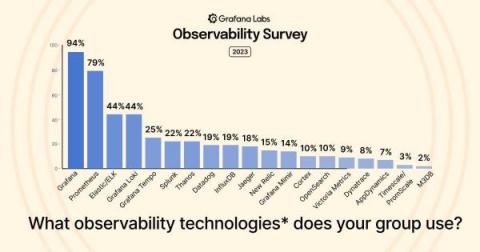
With countless observability tools, data sources, and environments to juggle, the organizations that deploy and manage today’s distributed applications often face an uphill battle to gain visibility into their application performance. That was a key takeaway from the Grafana Labs Observability Survey 2023, which incorporated input from more than 250 industry practitioners who are all too familiar with these complexities.

Beyond Observability and Tracing: Doing More With The Data We Have

Observability is a term that has been thrown around a lot in the past few years in the software development industry. Different people use it in different ways, but one thing that is clear is that it attempts to provide a solution to a real pain engineers are feeling. It is the pain of not knowing what is happening in the microservices architecture and how and why systems are behaving in production.

Elastic Common Schema and OpenTelemetry - A path to better observability and security with no vendor lock-in

At KubeCon Europe, it was announced that Elastic Common Schema (ECS) has been accepted by OpenTelemetry (OTel) as a contribution to the project. The goal is to achieve convergence of ECS and OpenTelemetry’s Semantic Conventions (SemConv) into a single open schema that is maintained by OpenTelemetry. This FAQ details Elastic’s contribution of Elastic Common Schema to OpenTelemetry, how it will help drive the industry to a common schema, and its impact on observability and security.

Lightstep from ServiceNow deepens commitment to OpenTelemetry project

At Lightstep, we’ve seen many organizations grapple with “cloud-native sticker shock” as they come to understand that these complex systems require sifting through massive amounts of data across architectures and proprietary solutions. In today’s macroeconomic environment, organizations are looking to reduce costs while driving innovation, especially when it comes to cloud-native applications.

The Three Pillars of Observability: Metrics, Logs and Traces

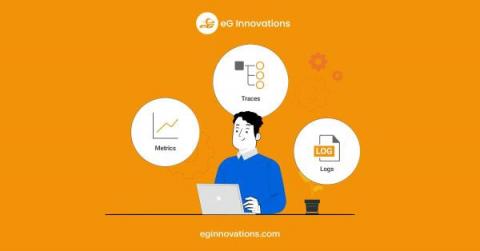
Metrics, Logs and Traces are often referred to as The Three Pillars of “Observability“. The term observability has been used in control theory to refer to how the state of a system can be inferred from the system’s external outputs. Applied to IT, observability is how the current state of an application can be assessed based on the data it generates. Applications and the IT components they use provide outputs in the form of metrics, events, logs and traces (MELT).