Operations | Monitoring | ITSM | DevOps | Cloud

SCOM

The latest News and Information on Service Center Operations Manager and related technologies.

Build VS Buy: How to get the most out of your SCOM monitoring

Microsoft's System Center Operations Manager, SCOM, is one of several monitoring platforms available on the market. It is widely adopted and has great potential to help you create a stable and robust IT environment. To succeed with that, however, is not always straightforward. To fully benefit from SCOM, the right resources need to be in place and optimized- time, competence, and money.

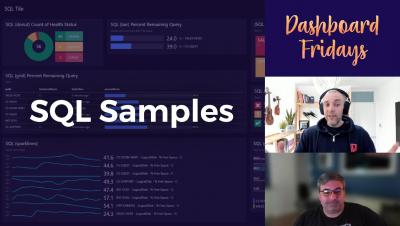
Dashboard Fridays: Example SQL Samples Dashboard

Join SquaredUp's Adam Kinniburgh and fellow virtualisation expert Shawn Williams as they showcase this SQL Sample dashboard. This dashboard was designed to demonstrate how the same base SQL query could be used with each of SquaredUp’s visualizations. Each SQL visualization slightly modifies how the data is presented to target user requirements. Tune in to learn how it was made, the challenges it solves, and Shawn's top tips for building it yourself.

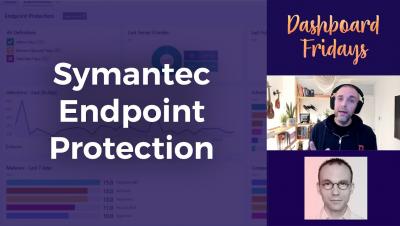
Dashboard Fridays: Sample Symantec Endpoint Protection (SEP) Dashboard

Join SquaredUp's Adam Kinniburgh and SCOM community hero Ruben Zimmermann as they showcase this example SEP Dashboard. Giving an overview of the status of the various endpoint protection systems, this dashboard is used by the IT team to keep on top of device security, and by the service desk to escalate appropriately.

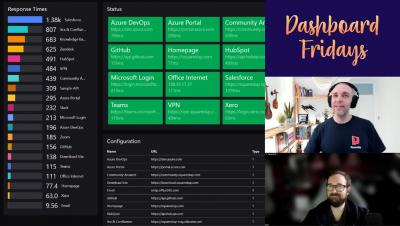
Dashboard Fridays: Sample UptimeRobot Dashboard

Join Adam Kinniburgh and Ashley Thompson as they showcase this example UptimeRobot Dashboard. Built in SquaredUp with the powerful WebAPI tile, this dashboard gives an overview of monitoring configured using UptimeRobot’s website monitoring features. Query UptimeRobot for information about your web tests, summarize them, and create a slick UptimeRobot dashboard in SquaredUp. This is an example of querying the web test data, though the other data sets are equally easy to pull in!

NiCE Linux PowerPC Management Pack 1.20 released

The NiCE Linux PowerPC Management Pack 1.20 is an enterprise-ready Microsoft SCOM add-on for advanced IBM PowerPC on Linux monitoring. It supports Linux PowerPC administrators in centralized health and performance monitoring to improve user experience and business results. The Management Pack provides clear and precise performance indicators and timely alerts enriched by pinpointing problem identification and troubleshooting information.

SCOM 2022: What to expect and what you need to know

Microsoft System Center Operations Management team has been busy with new features and updates for SCOM. The most recent version, SCOM 2019, came out on March 14th, 2019. The release date for the upcoming SCOM 2022 has been announced to be globally available in Q1 2022. This blog post will provide an overview of some of the features you can expect to see in SCOM 2022 and how those changes may affect your experience of SCOM monitoring as a user or customer.

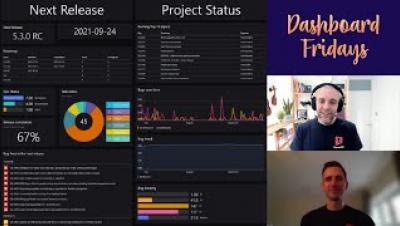
Dashboard Fridays: Sample JIRA Health dashboard

Join SquaredUp's Adam Kinniburgh and Tim Wheeler as they showcase this example Jira Health Status dashboard. Offering a quick view of the state of your next release, alongside the health of the Jira project as a whole, this dashboard uses SquaredUp’s Web API and PowerShell tiles to improve on Jira’s native dashboarding capabilities. Tune in to learn how it was made, the challenges it solves, and our top tips for building it yourself.

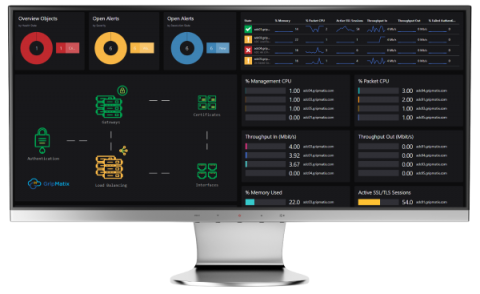
Get control back into the Control Room

This article explains how SquaredUp for SCOM leverages the true power of the SCOM platform: the SCOM object model. I believe in dashboarding you need simplicity and granularity all in one. Simplicity for your Control Room, which gives clear and quick insight. Granularity and detail for your system management engineers to be able to drill-down into details and find that Root-Cause quickly.