Operations | Monitoring | ITSM | DevOps | Cloud

Profiling

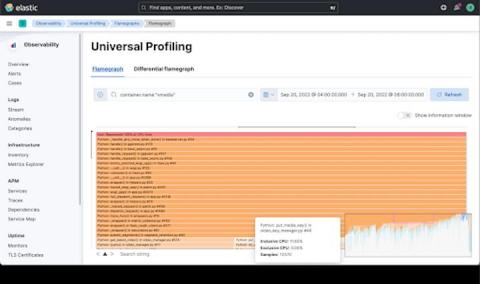
Elastic Universal Profiling helps you deliver fast, affordable, and efficient services

So, what is Universal Profiling™? Universal Profiling™ is fast emerging as an important component of observability. A standard feature inside hyperscalers since approximately 2010, the technology is slowly percolating into the wider industry. Universal Profiling™ allows you to see what your code is doing all the time, in production across a wide range of languages and can profile both user-space and kernel-space code.

Optimize your .NET application performance with the Datadog Continuous Profiler

.NET is a framework built by Microsoft that simplifies the complexities of developing cross-platform applications. Using.NET, developers can create powerful applications with rapid response times and more. We’re excited to announce that the Datadog Continuous Profiler now provides general support for.NET applications, including.NET Framework, .NET Core, and.NET 5+.

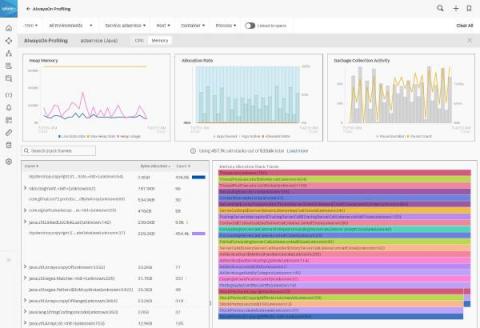
Splunk APM Expands Code Profiling Capabilities with Several New GAs

We’re excited to share new Splunk capabilities to help measure how code performance impacts your services. Splunk APM’s AlwaysOn Profiling now supports.NET and Node.js applications for CPU profiling, and Java applications for memory profiling. AlwaysOn Profiling gives app developers and service owners code level visibility into resource bottlenecks by continuously profiling service performance, at minimal overhead.

How continuous profiling can help track resource usage, reduce latencies, and more

In 2019, Polar Signals Founder and CEO Frederic Branczyk predicted that continuous profiling would be the future of observability. Today, he’s making that future a reality with his open source continuous profiling tool, Parca. In this episode of “Grafana’s Big Tent” podcast, our hosts Matt Toback and Tom Wilkie chatted with Frederic about how he got his start in the continuous profiling world and how he’s built an active open source community around Parca.

Continuous Profiling: A New Observability Signal

We’ve all grown used to logs, metrics and traces serving as the “three pillars of observability.” And indeed they are very important telemetry signals. But are they indeed the sum of the observability game? Not at all. In fact, one of the key trends in observability is moving beyond the ‘three pillars: One emerging telemetry type shows a particularly interesting potential for observability: Continuous Profiling.

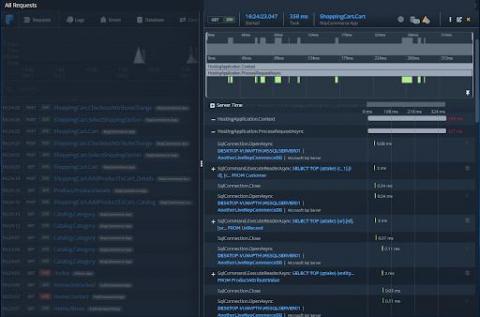
Prefix Premium - Profile, Test & Fix Code As Your Write It

Like all of us today, I’m buying more and more products and services online. But even the slightest hiccup in my digital experience might cause me to switch vendors. Multiply that risk by millions – the result of digital commerce growing at an exponential rate – and it’s easy to see how bad user experiences could literally sink a company.

Continuous Performance Improvement of HTTP API

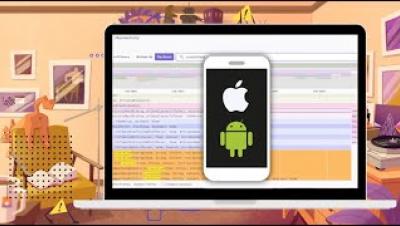
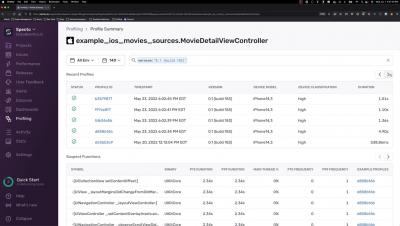
The following guest post addresses how to improve your services’s performance with Sentry and other application profilers for Python. Visit Specto.dev to learn more about application profiling and Sentry’s upcoming mobile application profiling offering. We’re making intentional investments in performance monitoring to make sure we give you all the context to help you solve what’s urgent faster.