Operations | Monitoring | ITSM | DevOps | Cloud

Analytics

How To Determine When a Host Stops Sending Logs to Splunk...Expeditiously

So I've only been at Splunk for 8 months, and in the short amount of time I've been here, one of the most common questions I've been asked is “How do I get an alert when Splunk is not receiving logs?". As a matter of fact, if I had $0.05 each time I was asked this question, I would have $0.25! Surprisingly, with this being such an often-asked question, I haven't been able to find much documentation on how to accomplish this using the native features of Splunk.

Tips and Tricks from Elastic Support: Setting up and running your cluster

Setting up and running an Elasticsearch cluster is easy at first, but some planning and design can help preventing many issues when going live gets real and your cluster needs to scale up. Cris da Rocha from the support team at Elastic will present some tips and tricks, learned from the experience of Elastic Support on how to do things better.

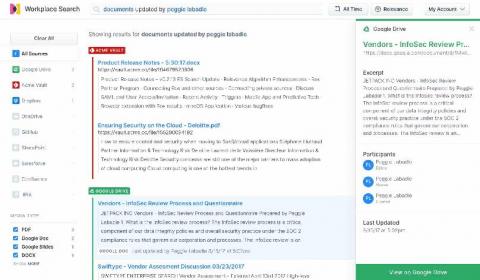
Searching Google Drive: Better collaboration with Elastic Workplace Search

While Google G Suite is an indispensable productivity and collaboration tool for modern businesses, all too frequently content tends to pile up in the far corners of Google Drive, making content search and discovery difficult. Spending valuable time sifting and searching through tens of thousands of documents to find the right one has become all too common, and most workers spend several hours per week searching for information.

How to add powerful (Elastic)search to existing SQL applications

Elasticsearch has a lot of strengths (speed, scale, relevance), but one of its most important strengths is its flexibility to be added to existing environments without the need for any sort of architectural overhaul. If you are a sysadmin (dev, sec, ops, etc.), you know just how appealing this is. So many legacy systems remain in place not because they are perfect, but because replacing them would cost time and money that you don't have.

Good Catch: Monitoring Revenue When it Matters Most

Revenue monitoring not only involves monitoring huge amounts of data in real-time but also finding correlations between thousands, if not millions, of customer experience and other metrics. Are traditional monitoring methods capable of detecting a correlation between a drop in user log-ins and a drop in revenue as it’s happening? For many reasons, the answer is no.

Tracking COVID-19 Data in South America Using Telegraf and InfluxDB

I wanted to better understand how COVID-19 has been developing in South America. As I’ve recently started playing with InfluxDB, the open source time series database, I created a dashboard of cases and deaths using InfluxData’s platform. I usually use InfluxDB, Chronograf, Grafana, Zabbix and other similar solutions to monitor services and systems. However, until this point, I hadn’t used them to process and visualize other kinds of data.

A Cost Comparison: ELK vs Proprietary Log Analytics

The large volumes of logs, metrics, and traces generated by scaling cloud environments can be overwhelming, but they must be collected to identify and respond to production issues or other signals showing business or application issues. To collect, monitor, and analyze this data, many teams choose between open source or proprietary observability solutions.

Splunk - Creates real-time business impact from data

From dealing with security concerns to production monitoring, businesses need to analyze the log data of their systems to ensure everything is functioning normally. In a computing context, a log refers to automatically produced and time-stamped documentation of events related to a particular system. Analysis of log data helps businesses comply with regulations, security policies and audits, understand online consumer behavior, and comprehend system troubleshoots.