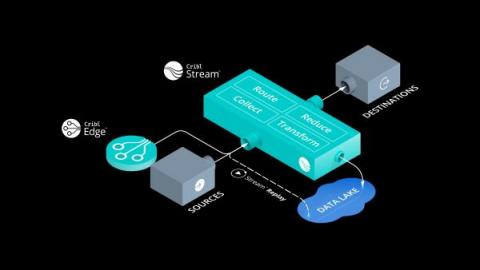
Announcing Cribl Edge & Cribl Stream
In 2022, administrators are still managing agents which collect data for observability and security the same way they did 15 years ago: typing in configuration files by hand. A lot has changed since 2006 when Amazon announced AWS. Instead of racking and stacking servers in data centers, we’re spinning up compute resources in a variety of forms – at the click of a button, or automatically through APIs.