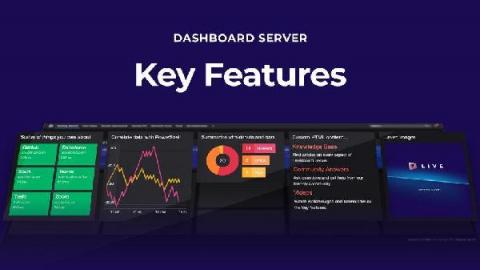
We recently launched the public preview of a new tool that lets anyone dashboard anything – for free. Meet Dashboard Server! You can download it free because we wanted to get our incredible dashboards in the hands of more people. The SCOM community know us well but our dashboards are perfect for so many use cases beyond System Center monitoring. And if you love them as much as we think you will, all we ask in return is that you share that love by spreading the word.
In a previous post I explained how to send metrics to Logz.io Infrastructure monitoring with Prometheus—now let’s analyze them by building Prometheus dashboards and visualizations in our metrics UI! Once you’ve started to send metric data to Logz.io, how do you visualize and interpret that data so that it’s useful for you? Logz.io Infrastructure Monitoring provides powerful querying and visualization of your data.
Windows event logs are important for security, troubleshooting, and compliance. When you analyze your logs, you can monitor and report on file access, network connections, unauthorized activity, error messages, and unusual network and system behavior. However, Windows servers produce tens of thousands of log entries every day.
Monitoring has always been a crucial operation in a software development cycle. This is mainly because of the complexity of industry-level IT and consumer-facing product development. Additionally, there is an ever-growing demand for rapid upgrades in products. To meet these requirements, streamlined performance and stability have become more important than ever; and without effective monitoring practices, they appear difficult to achieve.