Operations | Monitoring | ITSM | DevOps | Cloud

Latest posts

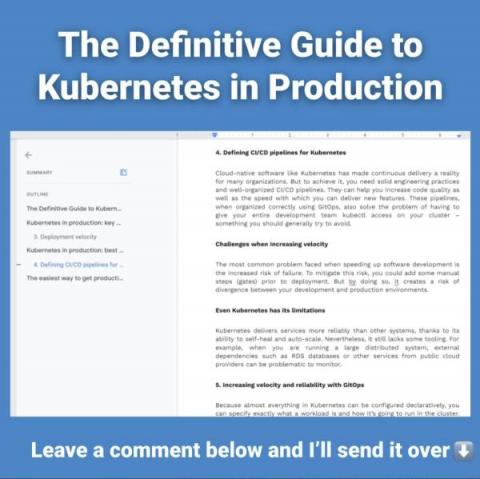
The Definitive Guide to Kubernetes in Production

Kubernetes has quickly grown in popularity, also due to its flexibility and power as a container orchestration system. It can scale virtually indefinitely, which has enabled it to provide the backbone for many of the world’s most popular online services. Plus, it is accessible and easy to set up. But, Kubernetes also comes with a few challenges in production.

Help Desk vs Service Desk: How to Choose the Right One

You’ve heard the term IT help desk. You’ve probably also heard of IT service desks. They’re pretty much the same thing, aren’t they? They sound similar enough, so when people start throwing around mentions of help desk vs service desk, you don’t raise an eyebrow. After all, you don’t want to seem like you don’t know what you’re talking about. Here’s the thing: an IT help desk differs from an IT service desk.

Black Friday log management (with the Elastic Stack) checklist

For this Black Friday, Sematext wishes you: Now seriously, applications tend to generate a lot more logs on Black Friday, and they also tend to break down more – making those logs even more precious. If you’re using the Elastic Stack for log management, in this post we’ll share some tips and tricks to prepare you for this extra traffic.

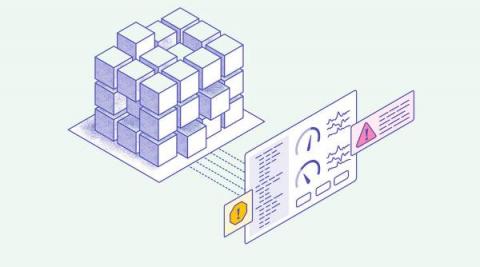
Full-Stack Observability Guide

Like cloud-native and DevOps, full-stack observability is one of those software development terms that can sound like an empty buzzword. Look past the jargon, and you’ll find considerable value to be unlocked from building observability into each layer of your software stack. Before we get into the details of observability, let’s take a moment to discuss the context.

Hyperview DCIM 3.6 Software Release

ServiceNow CMDB integration is now available! As well, we continue to roll out enhancements to Firmware Management and 3D view. Now you can view, search and report on the current firmware version for all your assets, both Managed and Unmanaged. In 3D view, you can quickly hone in on a specific set of racks or assets using Focus Mode. Plus, Hyperview now generates a multi-level Heat Map for more nuanced temperature ranges.

Gremlin: Introduction to Chaos Engineering

Creating resilient software is a fundamental necessity for modern cloud applications and architectures. As systems are increasingly being distributed by design, the potential for unplanned failure and unexpected outages increases significantly. As a result, many organizations - both big and small - have embraced Chaos Engineering. Curious how Chaos Engineering can make your systems more resilient? This webinar will give you an in-depth understanding of what Chaos Engineering is, why it's crucial to prevent outages, and how you can use it to build resilience into your own systems.

Elastic: Best practices for managing logs, metrics, and APM with Elastic Observability

Observability is more critical than ever before, and many enterprise organizations have 10 or more monitoring tools. But with Elastic Observability, you can bring your logs, metrics, and APM traces together at scale in a single stack to monitor and react to events happening anywhere in your environment. We'll show you the tools you need to deploy Elastic Observability your way. Learn how to manage logs, metrics, and APM on Elastic Cloud - the official managed Elasticsearch experience with powerful, out-of-the-box solutions for enterprise search, observability, and security.

Key metrics for monitoring Cilium

Cilium is a Container Network Interface (CNI) for securing and load-balancing network traffic in your Kubernetes environment. As a CNI provider, Cilium extends the orchestrator’s existing network capabilities by giving teams more control over how they build their applications and monitor traffic. For example, vanilla Kubernetes installations typically rely on traditional firewalls and Linux-based network utilities like iptables to filter pod-to-pod traffic by an IP address or port.

Monitor Cilium and Kubernetes performance with Hubble

In Part 1, we looked at some key metrics for monitoring the health and performance of your Cilium-managed Kubernetes clusters and network. In this post, we’ll look at how Hubble enables you to visualize network traffic via a CLI and user interface. But first, we’ll briefly look at Hubble’s underlying infrastructure and how it provides visibility into your environment.