Mailchimp
Not subscribed to OpsMatters Newsletter


Due to innovations in technology and automation, technology keeps changing and transforming with time. IT monitoring and management is an important aspect of all organizations regardless of their size, location, or workload. When it comes to IT processes, issues and protocols, all concepts are universal and face similar issues everywhere. This IT management terms or IT monitoring terms glossary brings together numerous IT components, issues, protocols and processes.
Virtualization environments of today are mostly driven by VMware due to its stability, scalability, and power. Aside from the configuration and architecture design, one must also consider the performance of the physical layer, hosted applications, and virtual machines. VMware provides tools that help monitor your virtual environment and find out the source of existing and potential issues.
Welcome to the Civo update for July 2021. In this edition we unveil some of the data from our Kubernetes in 2021 developer survey, a sneak peek at GitHub Copilot, and a case study on how Civo and StorageOS combine to provide cloud native storage for our Kubernetes platform.
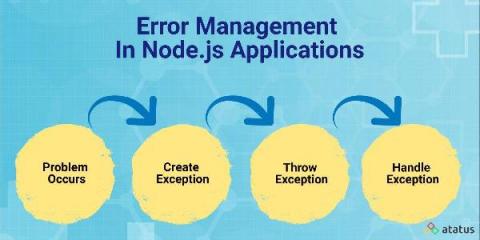
No one is perfect in this world including machines. None of our days pass without having errors faced in our professional life. Whenever we are facing any issues/errors while working rather than worrying, let us all fix our mind like we are going to learn something new. This will make your tasks easier. One of our friend Error Handling will help us in fighting with these errors. These reduce our pressure by finding the errors and guide us to achieve the desired output.
In this post we will discuss some key considerations and strategies to monitor your AWS Lambda functions. This will include: which Lambda metrics you’ll want to monitor, how to collect AWS Lambda metrics with Prometheus and Logz.io, how to create a monitoring dashboard with alerts, and how to search and visualize your metrics.
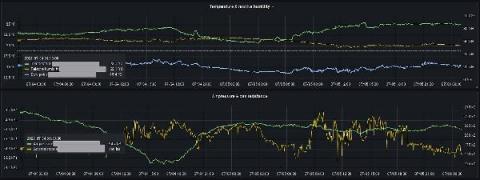
We recently had a hackathon at Grafana Labs. Anyone who wanted could get several work days without normal responsibilities to do whatever they found meaningful in the wider Grafana community and/or Grafana Labs commercial offerings. This allowed me to invest some time into Kraken, a project designed for reading out different sensors, and to update it for modern hardware and libraries.