IT analytics in 90 seconds: Manage SLAs across several managed accounts
Monitor SLA breaches and ensure better compliance rates across your managed help desk accounts using the SLA violations report in Analytics Plus.


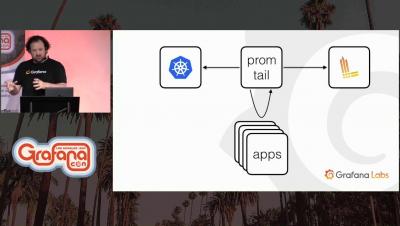
Alerts are a core part of monitoring systems. Using alerts keeps you aware of changes within your infrastructure and applications, helping you identify and respond to issues faster. Log management solutions like LogDNA provide an ideal environment for configuring alerts, since it allows you to create detailed alerts based on your log data. Rather than manually search for problems, you can use alerts to scan your log data in real-time and receive immediate notifications on potential problems.
Customer success can be a serious differentiator and competitive advantage for companies today. Everyone wants to ship quality products to their customers faster, and the rise of subscription-based pricing and SaaS applications in the last decade means that ensuring customer success is a more critical part of the business than ever.