Operations | Monitoring | ITSM | DevOps | Cloud

APM

The latest News and Information on Application Performance Monitoring and related technologies.

The art of software engineering management

Like any leadership role, leading an engineering team in a mature, compact company like Raygun comes with both honor and responsibility. Leading a major development project is a bit like conducting a symphony orchestra, where every individual plays a crucial role and has a great impact on the work they release to customers and end-users.
Sponsored Post

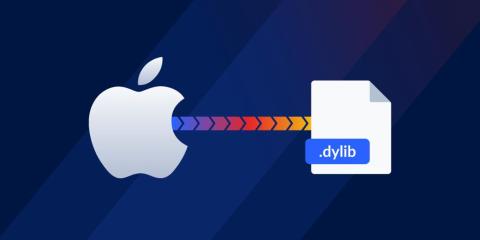
Symbolicating stack traces from Apple system libraries

In the world of software development, quickly finding and fixing errors drives better experiences for both end-users and developers. One key tool in this process is the symbol map, which records debugging information that was lost in the compilation process. Symbol maps (or source maps if we're talking JavaScript) connect the code developers write to the minified code in production, making it easier to decipher crashes by pinpointing the exact source code that caused the error.

CTO Fireside Chat #cto #asana #datadog #leadership #ml #ai #shorts

Building large scale technical systems is hard, but building and scaling high performing technical organizations is even more difficult. In this session, Datadog Co-founder and CTO Alexis Lê-Quôc will sit down with Prashant Pandey, Head of Engineering at Asana, to discuss their approach to engineering leadership. They’ll share the hard-learned lessons from their long careers to help you cultivate better technical teams, covering topics from staying in tune with new technologies, enabling innovation , shipping modern ML and AI-based features, and scaling teams.

OpenTelemetry Auto & Manual Instrumentation Explained with a Sample Python App

OpenTelemetry is an open-source observability project that provides a set of APIs, SDKs, and tooling for collecting, generating, and exporting telemetry data. It provides instrumentation libraries in all major programming languages. In this article, we will demonstrate the automatic and manual instrumentation of Python applications. In this tutorial, we cover: If you want to jump straight into implementation, start with this prerequisites section.

57% of UK consumers say digital bliss a must for festive fun, Cisco survey reveals

A recent survey by Cisco highlights the pivotal role of digital applications and services in enhancing the holiday season experience. With a global increase in application usage anticipated, the report underscores the need for brands to ensure optimal performance of their digital services or risk dampening the festive spirit.

Mocha vs Jasmine, Chai, Sinon & Cucumber in 2024

Javascript has been enabling browsers for years, and for better or for worse, the internet is made of JS. NodeJS brought it to the server side. TypeScript has wrapped familiar object-oriented, statically-typed syntax around it. Anywhere you look, you’ll find Javascript: on the client, server, mobile, and embedded systems.

Datadog on Kubernetes Node Management #datadog #kubernetes #observability #infrastructure #shorts

Datadog, the observability platform used by thousands of companies, runs on dozens of self-managed Kubernetes clusters in a multi-#cloud environment, adding up to tens of thousands of nodes, or hundreds of thousands of pods. This infrastructure is used by a wide variety of engineering teams at Datadog, with different feature and capacity needs.

Detect and diagnose purchase abandonment with automation

By using the Experience Journey Map, users can quickly see where in the browser and mobile journey users are dropping, or where in the conversion process are users most likely having issues. Dive deeper into what may be an underlying cause, perhaps geographic or by device type rather than due to an application fault. Reduce the amount of investigative work and fix what matters most importantly, by pinpointing where and why the user experiences issues.

re:Invent Recap Livestream

Did you miss this year’s re:Invent? Or maybe you were onsite but too busy deep diving on certifications, new products, and networking. Don’t worry – the Datadog team is streaming right to your home on December 5th to recap all of the highlights from the event. Join Andrew Krug from Datadog’s Technical Community and a host of AWS guests LIVE to hear about exciting announcements from AWS re:Invent 2023, Datadog’s latest product launches, and a run-down of the best On Demand sessions that you’ll want to make sure to tune into.

Health Check Monitoring With OpenTelemetry | Complete Code Tutorial

In this tutorial, you will learn how HTTP endpoints can be monitored with OpenTelemetry. You will use the OpenTelemetry Collector to collect metrics from the target endpoint and send them to SigNoz for monitoring and visualization. In this tutorial, we cover: If you want to jump straight into implementation, start with this prerequisites section.