Operations | Monitoring | ITSM | DevOps | Cloud
January 2024
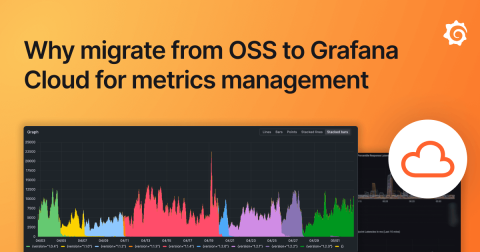
Why companies migrate from OSS to Grafana Cloud for metrics management
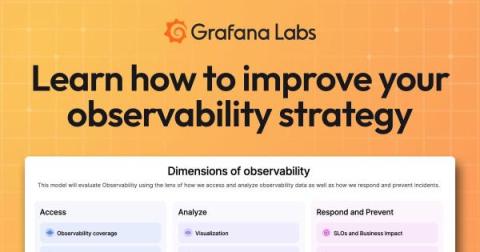
How to improve your observability strategy: Introducing the Observability Journey Maturity Model
Inside TeleTracking's journey to build a better observability platform with Grafana Cloud
Getting started with Application Observability for Java
Adding data sources to Grafana (Loki, Tempo, & Mimir) - Grafana for Beginners Ep. 6
How to manage Grafana instances within Kubernetes
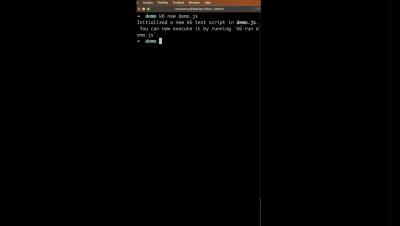
Demo: Kubernetes support in Grafana Beyla
Grafana Beyla 1.2 release: eBPF auto-instrumentation with full Kubernetes support
Grafana 10.3 release: Canvas panel updates, multi-stack data sources, and more
Accelerate TraceQL queries at scale with dedicated attribute columns in Grafana Tempo
The Story of Grafana | Episode 3: Open (Source) for Business | Grafana Documentary
Observability for business decision making: technology challenges and approaches
How to do continuous profiling right with Grafana Pyroscope's Ryan Perry (Grafana Office Hours #26)
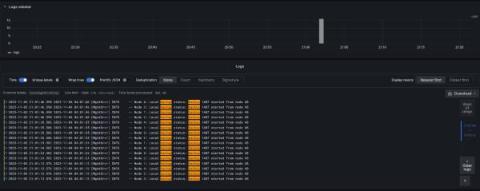
How to monitor a MySQL NDB cluster with Grafana
Jason Mallory is a senior MySQL/SQL server database administrator who develops monitoring and alerting solutions for operations departments in the aerospace industry. Jason is also a Grafana Champion. MySQL Network Database — or NDB, for short — is an in-memory, sharded database platform. Consisting of several moving parts, NDB can be one of the most challenging database platforms to monitor. However, monitoring NDB cluster health is crucial to ensure reliability and performance.
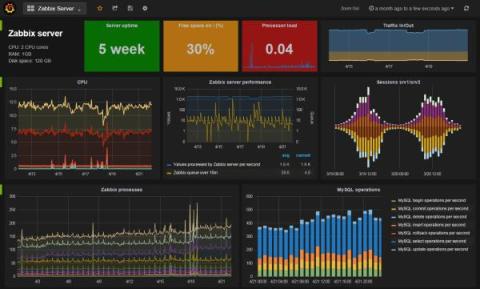
Zabbix plugin for Grafana: Grafana Labs will manage and maintain the popular plugin
I’m happy to share some exciting news! Grafana Labs is taking ownership of the Zabbix plugin, one of the most popular third-party data sources for Grafana over the years. The Zabbix plugin for Grafana allows you to visualize data from the Zabbix monitoring system, offering a quick and powerful way to create dashboards. I personally started the project in 2015, with the goal of bringing a better dashboarding experience to Zabbix users.
Incident response that's fast and cost-effective: Why 3 companies chose Grafana Cloud
When an incident occurs, every second counts. On-call staff need to quickly get all the relevant information in front of them in a way that’s easy to digest so they can more successfully investigate the issue and communicate with relevant stakeholders.
Incident response that's fast and cost-effective: Why these 3 companies chose Grafana Cloud
When an incident occurs, every second counts. On-call staff need to quickly get all the relevant information in front of them in a way that’s easy to digest so they can more successfully investigate the issue and communicate with relevant stakeholders.
Set up a new Grafana Cloud Account - Grafana for Beginners Ep. 5
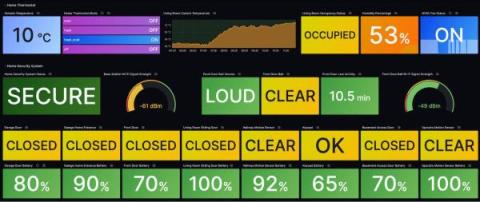
How to set up home automation: A beginner's guide with Grafana Cloud and Home Assistant
I first learned about Home Assistant when my previous job’s manager shared that he charms his wife by using home automation to have Alexa announce the weather as she starts getting ready for the day. After that, he showed us the cool Grafana dashboards where he visualizes his entire home automation setup on a screen in his basement. As fate would have it, I got a chance to work for Grafana Labs soon after that, and I started building my own home automation setup using Grafana Cloud.
How to deploy Grafana Beyla on Kubernetes as a sidecar container
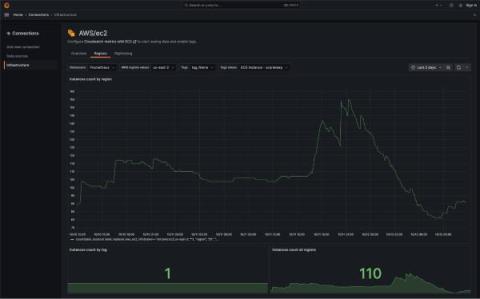
Monitor Amazon EC2: key metrics for instances, regions, and more in one view
Amazon EC2 was one of the first services available on AWS, helping propel the cloud platform into the mainstream of IT. And while EC2 instances come in a wide range of sizes and flavors to address all sorts of use cases, keeping tabs on those instances isn’t always easy. That’s why we’re excited to introduce our new EC2 monitoring solution in Grafana Cloud.
Observability trends and predictions for 2024: CI/CD observability is in. Spiking costs are out.
From AI to OTel, 2023 was a transformative year for open source observability. While the advancements we made in open source observability will be a catalyst for our continued work in 2024, there is even more innovation on the horizon. We asked seven Grafanistas to share their predictions for which observability trends are on their “In” list for 2024. Here’s what they had to say.
Grafana 10.2.3 release: new features and breaking changes
On Dec. 18, 2023, we unintentionally introduced some new features and two minor breaking changes in the Grafana 10.2.3 patch release. These changes were originally intended for Grafana 10.3, which we plan to release later this month, but these commits were merged into the 10.2.3 release branch early due to a mistake in our release process. Because Grafana 10.2.3 introduces more changes than expected in a typical patch release, there’s a risk of more bugs than expected.
Introduction to eBPF with Grafana Beyla, with Nikola Grcevski (Grafana Office Hours #25)
The concise guide to Loki: How to work with out-of-order and older logs
For this week’s installment of “The concise guide to Loki,” I’d like to focus on an interesting topic in Grafana Loki’s history: ingesting out-of-order logs. Those who’ve been with the project a while may remember a time when Loki would reject any logs that were older than a log line it had already received. It was certainly a nice simplification to Loki’s internals, but it was also a big inconvenience for a lot of real world use cases.
With OpenTelemetry, ComplyAdvantage overhauled its observability (twice)
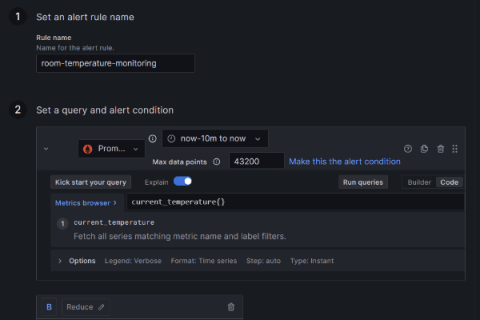
How to create alerts to monitor sensor data with Grafana, Prometheus, and Telegram
When monitoring sensor data, such as data from a weather station, a home security system, or a home automation assistant, it’s useful to have an alerting system in place, as well. By setting up alerts for sensor data, you can automatically receive notifications when any significant event occurs — whether that’s someone arriving at your front door or a thunderstorm rolling in.


