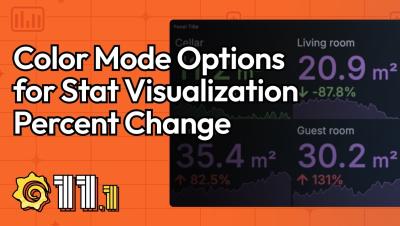
Stat Visualization Percent Change Color Mode in Grafana 11.1 (Demo) | Grafana
We’ve introduced options to change the color mode for stat visualization percent changes. Want your positives to show up as red and negatives to show up as green? With this feature, now it’s possible.