Dashboards

Sponsored Post

5 ELK Stack Pros and Cons

Is your organization currently relying on an ELK cluster for log analytics in the cloud? While the ELK stack delivers on its major promises, it isn't the only search and analytics engine - and may not even be your best option for log management. As cloud data volumes grow, ELK monitoring can become too costly and complex to manage. Fast-growing organizations should consider innovative alternatives offering better performance at scale, superior cost economics, reduced complexity and enhanced data access in the cloud.

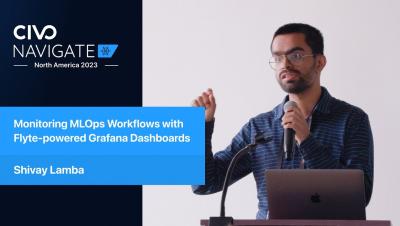
Monitoring MLOps Workflows with Flyte-powered Grafana Dashboards - Civo Navigate NA 2023

Learn how to monitor MLOps workflows effectively with Flyte-powered Grafana dashboards in this talk from Navigate NA 2023. Shivay Lamba discusses the importance of monitoring in the MLOps journey, highlighting the unique challenges in monitoring machine learning models compared to standard software development. Discover how Flyte, an open-source project, can help manage and monitor ML tasks efficiently, and see a live demonstration of setting up Grafana dashboards to visualize system metrics like CPU and GPU utilization. Take advantage of this opportunity to enhance your MLOps monitoring skills and optimize your machine learning workflows.

How to monitor your feature flags with LaunchDarkly and Grafana

Feature management is an emerging set of tools and techniques for developing and testing software based around feature flags. It’s intended to increase productivity and performance, as well as improve software quality. Of course, you’ll also need to keep tabs on all those feature flags, so it only makes sense to pair feature management with observability for a more holistic view of your software development cycles.

How Grafana query caching and Amazon Timestream make dashboards faster and more cost-effective

This blog post was co-authored by Igor Shvartser, Senior Technical Product Manager at Amazon Timestream, and Michael Mandrus, Senior Software Engineer at Grafana Labs. Grafana Labs Senior Software Engineers Stephanie Hingtgen and Kevin Minehart also helped with the content.

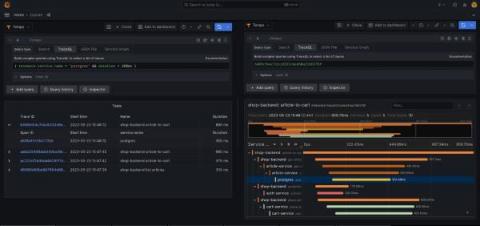
Simplify managing Grafana Tempo instances in Kubernetes with the Tempo Operator

I’ve been working with Grafana Tempo for about half a year now, and one thing I like about it is that Tempo requires only object storage for storing traces, which is easy to set up in both cloud environments and on-premises. Another outstanding feature is TraceQL, which allows searching for relevant traces with a powerful query language.

Dashboard Fridays: Public Releases

Build using the Jira and Pendo plugins, this SquaredUp dashboard provides a sense of how popular our latest Dashboard Server release is with customers, and whether any bugs have been raised against it. We can now get a quick overview of any issues in the latest release that are affecting our customers. Plus, through the level of uptake of the new release, we can see if we have achieved the level of quality that we were aiming for.

New in Grafana 10: A UI to easily configure SAML authentication

In addition to the built-in user authentication that utilizes usernames and passwords, Grafana also provides support for various mechanisms to authenticate users, so you can securely integrate your instance with external identity providers. We are excited to announce that with the release of Grafana 10.0, we have introduced a new user interface that simplifies the configuration of SAML authentication for your Grafana instances.

Four reasons to try our next-gen dashboards

When you need to troubleshoot faster, rich out-of-the-box content lets you easily monitor the tools in your technology stack. Dashboards are key to our customers’ success — offering you deep insights at a glance and the ability to drill into the details most important to you. A couple years ago, we debuted a new style of dashboards, built on top of a scalable, flexible and extensible charting system.