Dashboards

Announcing Grafana Phlare, the open source database for continuous profiling at massive scale

At ObservabilityCON in New York City today, we announced a new open source backend for continuous profiling data: Grafana Phlare. We are excited to share this horizontally scalable, highly available database with the open source community — along with a new flame graph panel for visualizing profiling data in Grafana — to help you use continuous profiling to understand your application performance and optimize your infrastructure spend.

ObservabilityCON 2022: A guide to new OSS projects, LGTM stack updates, and more from Grafana Labs

ObservabilityCON 2022 is taking place today with a host of exciting announcements, from new OSS projects, partnerships, and integrations to the latest easy-to-use features in the Grafana LGTM stack. “As an OSS company, we prioritize interoperability. The big tent is at the heart of everything we do, and Grafana is at the heart of the wider ecosystem,” says Grafana Labs Co-founder and CEO Raj Dutt.

Introducing Grafana Faro, an open source project for frontend application observability

Today, during the ObservabilityCon 2022 keynote session, we announced a new open source project for frontend application observability, Grafana Faro. The project is launching with a highly configurable web SDK that instruments web applications to capture observability signals. This frontend telemetry can then be correlated with backend and infrastructure data for seamless, full-stack observability. There’s supposed to be a video here, but for some reason there isn’t.

Grafana ObservabilityCON 2022 Keynote

Live from New York, it’s Grafana ObservabilityCON! Join CEO/Co-founder Raj Dutt, VP of Technology Tom Wilkie, and members of the Grafana Labs engineering team for a look at the latest developments in the open and composable LGTM (Loki-Grafana-Tempo-Mimir) observability stack. Spoiler alert: There will be some exciting announcements!

Top 8 Open Source Dashboards

Before exploring open-source dashboard tools, we first need to learn about Dashboards and how they can be useful. A dashboard is a data visualization and management tool that visually tracks and analyzes the Key Performance Indicators (KPIs), business analytics metrics, infrastructure health and status, and data points for an organization, team, or process. It can be used to present operational and analytical business data with interactive data visualizations to your team.

Watch Grafana Labs CEO, Co-founder Raj Dutt discuss why companies need observability

Grafana Labs CEO and Co-founder Raj Dutt sat down with “NYSE Floor Talk” ahead of ObservabilityCON to discuss why companies are increasingly focused on observability as a means to improve customer satisfaction. In his conversation with Judy Khan Shaw, host of “NYSE Floor Talk,” Dutt also talked about Grafana Labs’ big tent philosophy and the growth of Grafana Labs and the Grafana open source community.

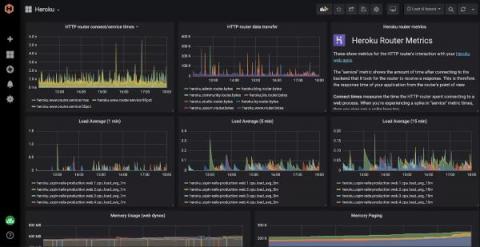
Installing the Hosted Graphite Heroku Monitoring & Dashboards Add-on.

HostedGraphite provides a complete infrastructure and application monitoring platform from a suite of open-source monitoring tools. Use Hosted Graphite and view all required metrics on beautiful dashboards in real time. Hosted Graphite offers a wide range of tools, add-ons, and plugins which make it possible to measure, analyze, and visualize large amounts of data about your applications with ease.

What can Elastic Synthetics tell us about Kibana Dashboards?

I like to leverage our technologies to ensure our products have a pleasant user experience. Elastic Synthetics enables you to configure it in an out-of-the-box experience directly through your Elastic Cloud deployment without the need to install anything! It also works across the globe with multiple locations you can choose from. Ever wondered how fast your web service is when accessed from Japan, Germany, or the eastern U.S.? Now you can do this by simply clicking on a checkbox.

Showcase dashboards securely and effortlessly with Skykit's offering in the Datadog Marketplace

For many organizations, making the most of the visibility Datadog offers into the health and performance of their infrastructure means displaying dashboards to stakeholders in various settings continuously and in real time. But the standard solutions for sharing dashboards to large-format displays can be onerous, involving sundry software and hardware and restrictive manual setups. These solutions can also pose significant security risks, since they tend to involve sharing passwords or devices.