Dashboards

Watch Grafana Labs CEO, Co-founder Raj Dutt discuss why companies need observability

Grafana Labs CEO and Co-founder Raj Dutt sat down with “NYSE Floor Talk” ahead of ObservabilityCON to discuss why companies are increasingly focused on observability as a means to improve customer satisfaction. In his conversation with Judy Khan Shaw, host of “NYSE Floor Talk,” Dutt also talked about Grafana Labs’ big tent philosophy and the growth of Grafana Labs and the Grafana open source community.

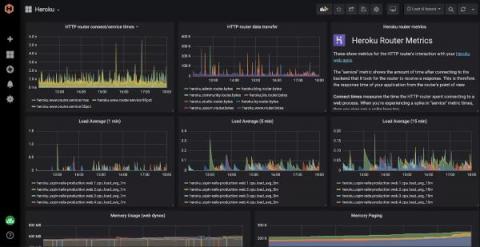
Installing the Hosted Graphite Heroku Monitoring & Dashboards Add-on.

HostedGraphite provides a complete infrastructure and application monitoring platform from a suite of open-source monitoring tools. Use Hosted Graphite and view all required metrics on beautiful dashboards in real time. Hosted Graphite offers a wide range of tools, add-ons, and plugins which make it possible to measure, analyze, and visualize large amounts of data about your applications with ease.

What can Elastic Synthetics tell us about Kibana Dashboards?

I like to leverage our technologies to ensure our products have a pleasant user experience. Elastic Synthetics enables you to configure it in an out-of-the-box experience directly through your Elastic Cloud deployment without the need to install anything! It also works across the globe with multiple locations you can choose from. Ever wondered how fast your web service is when accessed from Japan, Germany, or the eastern U.S.? Now you can do this by simply clicking on a checkbox.

Showcase dashboards securely and effortlessly with Skykit's offering in the Datadog Marketplace

For many organizations, making the most of the visibility Datadog offers into the health and performance of their infrastructure means displaying dashboards to stakeholders in various settings continuously and in real time. But the standard solutions for sharing dashboards to large-format displays can be onerous, involving sundry software and hardware and restrictive manual setups. These solutions can also pose significant security risks, since they tend to involve sharing passwords or devices.

Reduce MTTR and improve UX with Grafana Enterprise: Inside Optum's observability stack

Among the 12 greatest stressors in life, six revolve around healthcare issues. From loss of a loved one to pregnancy and even retirement, these events often involve interactions with healthcare services — interactions that can either add to an individual’s stress or, ideally, help alleviate it.

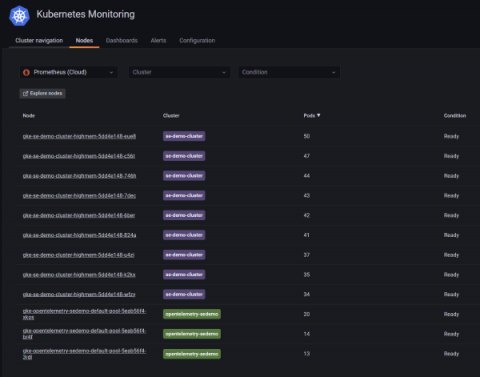
How to monitor the health and resource usage of Kubernetes nodes in Grafana Cloud

The spine is essential to perform every activity, like crawling, walking, or swimming. Just as the spine is necessary to enable these functions, your Kubernetes infrastructure needs a backbone to be efficient and effective. So if Kubernetes clusters act as the spine of your architecture, then Kubernetes nodes are like the vertebrae — they make up a Kubernetes cluster in the same way the vertebrae form the spinal column.

Dashboards vs. Reports: How to Get the Most out of Your ITSM Reporting Tools

At this point, we all know that reporting is an essential part of ITSM. It helps us to have clear information about the performance of the service desk and the support team and thus make better decisions. ITSM reporting tools consist of dashboards and reports, and though it might seem great to have only two, this often poses a question: when should I use each one? If you find yourself having a hard time deciding, this article is perfect for you! We’re about to oppose dashboards vs.

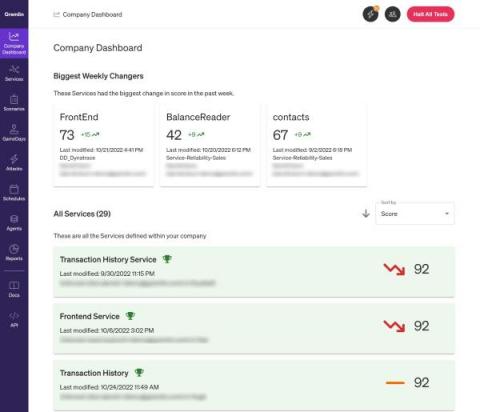
Managing and improving reliability using Gremlin's Reliability Dashboard

Part of a successful reliability program is being able to monitor and review your progress toward improving reliability. Being able to run tests on services is a big part of it, but how can you tell you're making progress if you can only see your latest test results? There should be a way to track improvements or regressions in your reliability testing practice across your organization in a way that's easy to digest. That's where the Reliability Dashboard comes in.

Grafana and Cilium: Deep eBPF-powered observability for Kubernetes and cloud native infrastructure

Today, Grafana Labs announced a strategic partnership with Isovalent, the creators of Cilium, to make it easy for platform and application teams to gain deep insights into the connectivity, security, and performance of the applications running on Kubernetes by leveraging the Grafana open source observability stack.