Dashboards
Grafana Agent 0.29.0 release: New OpenTelemetry components
Today the Grafana Agent team is excited to announce the release of Grafana Agent v0.29.0. This September, we introduced a new way to easily run and configure Grafana Agent called Grafana Agent Flow, our new dynamic configuration runtime built on components. Within Flow, we are also embracing Grafana Labs’ big tent philosophy by introducing OpenTelemetry (OTel) Collector components and converters for traces, metrics, and logs in Agent v0.29.0.
How to monitor Windows logs with the updated Windows integration for Grafana Cloud
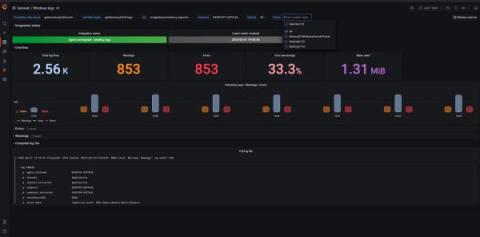
As we all know, Windows is one of the most popular operating systems in the world. It has a dominant share in the desktop computer market, with more than 70% of the machines running the operating system. It makes sense, then, that the Windows integration is also one of the most used and popular integrations in Grafana Cloud.
Grafana Labs Writers' Toolkit: This is the way
At Grafana Labs, we understand that clear, informative technical documentation is critical to users’ success, whether they’re just getting started or trying to quickly troubleshoot an issue. That’s why the Documentation and Technical Writing Team at Grafana Labs is pleased to announce the launch of our very first, very own writers’ toolkit.
New GKE dashboards and metrics provide deeper visibility into your environment
Google Kubernetes Engine (GKE) is a managed Kubernetes service that enables users to deploy and orchestrate containerized applications on Google’s infrastructure. Datadog’s GKE integration, when paired with our Kubernetes integration, has always provided deep visibility into the health and performance of your clusters at the node, pod, container, and application levels.
Announcing Grafana Phlare, the open source database for continuous profiling at massive scale
At ObservabilityCON in New York City today, we announced a new open source backend for continuous profiling data: Grafana Phlare. We are excited to share this horizontally scalable, highly available database with the open source community — along with a new flame graph panel for visualizing profiling data in Grafana — to help you use continuous profiling to understand your application performance and optimize your infrastructure spend.
ObservabilityCON 2022: A guide to new OSS projects, LGTM stack updates, and more from Grafana Labs
ObservabilityCON 2022 is taking place today with a host of exciting announcements, from new OSS projects, partnerships, and integrations to the latest easy-to-use features in the Grafana LGTM stack. “As an OSS company, we prioritize interoperability. The big tent is at the heart of everything we do, and Grafana is at the heart of the wider ecosystem,” says Grafana Labs Co-founder and CEO Raj Dutt.
Introducing Grafana Faro, an open source project for frontend application observability
Today, during the ObservabilityCon 2022 keynote session, we announced a new open source project for frontend application observability, Grafana Faro. The project is launching with a highly configurable web SDK that instruments web applications to capture observability signals. This frontend telemetry can then be correlated with backend and infrastructure data for seamless, full-stack observability. There’s supposed to be a video here, but for some reason there isn’t.
Grafana ObservabilityCON 2022 Keynote
Top 8 Open Source Dashboards
Before exploring open-source dashboard tools, we first need to learn about Dashboards and how they can be useful. A dashboard is a data visualization and management tool that visually tracks and analyzes the Key Performance Indicators (KPIs), business analytics metrics, infrastructure health and status, and data points for an organization, team, or process. It can be used to present operational and analytical business data with interactive data visualizations to your team.

