Dashboards
Dashboard Fridays: Sample SQLFacts dashboard
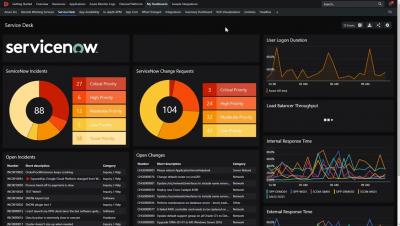
Express Demo: SquaredUp Azure Edition
How to upgrade to SCOM 2022 step-by-step
The long awaited SCOM 2022 is here! If you’d like to know what improvements to expect, check out our blog on SCOM 2022 key highlights. If you’re as excited as we are and would like to proceed with your upgrade, keep reading, this is the detailed step-by-step guide you are looking for. We will take you through the whole process, covering: Stick with us, and by the end of this blog you’ll have successfully upgraded to SCOM 2022!
100% office-based to remote-first: SquaredUp's journey
Back when everyone was talking about the ‘new normal’ and what the future of work would look like post-pandemic, SquaredUp was having a rethink too. SquaredUp has always been a 100%, office-based company with a heart for bringing people together. Richard Benwell, CEO, and the executive team had created a company that is truly fun, collaborative, and integrated, largely based on their drive to keep people connected and build an incredible community – in the office.
Grafana Labs announces $240 million Series D round led by GIC and welcomes new investor J.P. Morgan
Today, I’m happy to share that Grafana Labs has closed a $240 million Series D round of investment. This is a major milestone for us that goes well beyond the number of dollars. First, we are grateful to our internal team (affectionately called Grafanistas) and our community of users and customers. Without them, we would not have been given this opportunity.
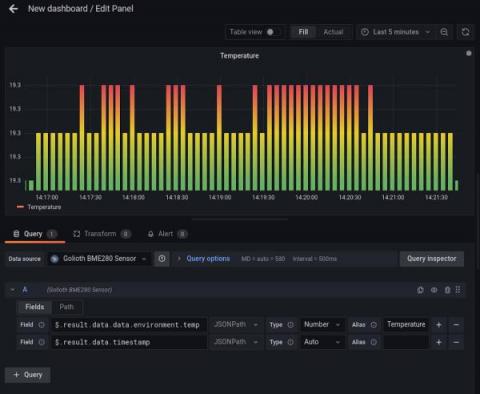
How to use WebSockets to visualize real-time IoT data in Grafana
Mike Szczys is a Developer Relations Engineer at Golioth. His deep love of microcontrollers began in the early 2000s, growing from the desire to make more of the BEAM robotics he was building. When he’s not reading data sheets, he’s busy as an orchestra musician in Madison, Wisconsin. At Golioth, a commercial IoT development platform, we love using the power of Grafana to easily visualize data from IoT installations where tens, hundreds, or even thousands of devices are reporting back.
Express Demo: SquaredUp SCOM Edition
Grafana Mimir Q&A with Grafana Labs CEO Raj Dutt
When Grafana Labs CEO and co-founder Raj Dutt announced to the team that the company would be launching Grafana Mimir, we knew that along with the public announcement, we would want to publish a Q&A. We collected questions from Grafanistas and Raj has answered them here.
Getting Started with Prometheus and Grafana
The world is moving towards a data-driven society, resulting in businesses gathering more data to leverage for profit. This data is either in structured forms like JSON/CSV/XML or unstructured forms like text written on a notepad or typed texts. Regardless of the data’s formatting, the important thing is the information it contains. Various tools in the market extract data from different agents and platforms that will improve your metric monitoring system.


