


SQUPCAST Ep. 6: What makes SquaredUp smart?
Joined this week by Richard, our Founder CEO, tune in to hear about some killer new features that are a big part of our vision for smarter dashboards. Not one to miss.
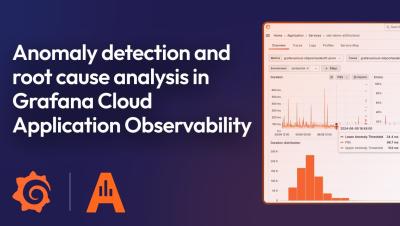
Anomaly detection and root cause analysis with Application Observability | Grafana Cloud
In this video, we walk you through the latest features of Grafana Cloud Application Observability, designed to accelerate anomaly detection and root cause analysis. Application Observability offers an out-of-the-box solution for monitoring applications and minimizing MTTR. It natively supports both OpenTelemetry and Prometheus and allows you to seamlessly unify application and infrastructure insights.

Improved anomaly detection and faster root cause analysis: the latest features in Grafana Cloud Application Observability
In recent years, “the biggest needs we’ve heard from our customers have been to make it easier to understand their observability data, to extend observability into the application layer, and to get deeper, contextualized analytics,” said Tom Wilkie, CTO of Grafana Labs, at ObservabilityCON 2023.

How CEOs Can Have a Bird's Eye View of Their Business While Traveling
The modern era is seeing businesses around the world become increasingly globalized. At the same time, given that remote work has become the norm, CEOs are finding themselves frequently on the move. According to European CEO, CEOs travel from 1 to 10 working days per month for business purposes. In fact, these top-level bosses spend more time traveling than in meetings.

Are dashboards dead? Not quite. They just haven't evolved
In discussions across the tech and data communities in recent years, a provocative idea has been gaining traction: the notion that dashboards are dead. The first time I came across this was in the article by Taylor Brownlow of the same name, "Dashboards are Dead". A worthwhile read. The article suggests that dashboards, as we known them, no longer serve the needs of modern data-driven organizations. Not through their own fault as such, more through misuse or over-asking.

Getting Started with Grafana Play - Learn, Explore, and Play with Grafana
Learn and experiment with Grafana in Grafana Play, our sandbox environment that allows you try out Grafana for yourself for free, no login required. Grafana Cloud is the easiest way to get started with Grafana dashboards, metrics, logs, and traces.

Grafana update: Service account tokens are replacing API keys
Enhancing security and providing flexible access control has always been part of our core mission at Grafana. In line with those efforts, we made service accounts generally available in Grafana 9.1. Service accounts are essentially machines simulating Grafana users, and they are used to run automated workloads — for example, counting the number of data sources in Grafana every day or provisioning alerts using Terraform.

CI/CD Dashboards
Whether you're after a Jenkins dashboard, a GitLab metrics dashboard or a CircleCI dashboard, SquaredUp lets you easily connect to your CI/CD data. Our flexible dashboards then allow you to combine CI/CD metrics with 100+ other data sources, such as Jira and GitHub.
Salesforce Plugin Spotlight
Salesforce dashboards for the whole company, without expensive additional licenses! Visualize your Salesforce data in our dashboards, then share them via a simple, secure URL. Combine data across accounts, across different tools, and build out that one-stop single pane of glass for your organization.