Dashboards
Introducing Grafana University: our virtual hands-on education platform that's free and easy to use
Grafana Labs has had a long commitment to educating our customers and community about all of our open source technologies and products, with our community Slack, webinars, conferences, documentation, and of course, this blog. In 2021, we decided that it was time to create a formal education program to provide more structured, repeatable, and scalable learning experiences – all while providing the same compelling and quality content our community is accustomed to.
Grafana 2021: Year in review
Numbers don’t lie — and the data shows that in a year in which we, once again, endured unpredictable changes, Grafana experienced unparalleled success. In June, we introduced Grafana 8.0, which included unified alerting, new visualizations, real-time streaming, and more. Since then we have introduced a host of new features as well as new data source plugins that only reinforce Grafana’s commitment to our “big tent” philosophy.
Grafana Labs in 2021: Top 10 moments of the year
Here’s a look back at the releases, products, community stories, and major announcements that defined another incredible year for Grafana Labs.
How product teams can manage their performance using Grafana, Prometheus, and Oracle metrics
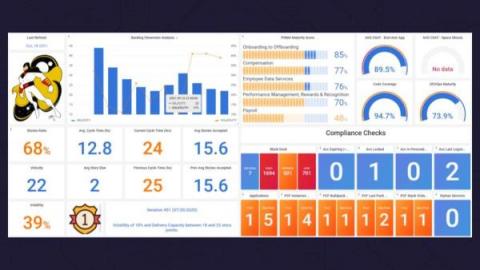
Ever known a project manager who thinks a task takes minutes when it really takes hours? One company has developed a helpful monitoring tool that not only helps project managers make more realistic estimates, but also helps product teams save time, increase efficiency, and improve their overall performance. At ObservabilityCON 2020, Walter Ritzel Paixão Côrtes, a product designer at Dell, gave a presentation about a data-driven solution his team developed called Product Team Observability.
Grafana EMEA meetup recap: shift left observability, AI and load testing, monitoring plants, and more
On Dec. 8, we gathered the Grafana EMEA community for another dynamic meetup. Experts from the Grafana Labs and k6 teams alongside observability pros from different organizations covered topics ranging from shift left observability practices to monitoring your green thumb at home with Grafana. In case you missed the virtual get together, here’s a recap of each talk along with the session videos.
Top Data Visualisation Tools (2023 Edition)
If you have been trying to compare all of the best data visualisation tools you may have found it difficult to find a detailed list that includes both open-source and proprietary solutions to help you compare and make an informed decision on what you need going forward. In this guide, you will find out everything you need to know about the leading solutions for data visualisation to help you get started with your next analysis project.
New in Grafana Loki 2.4: The Simple Scalable Deployment Mode
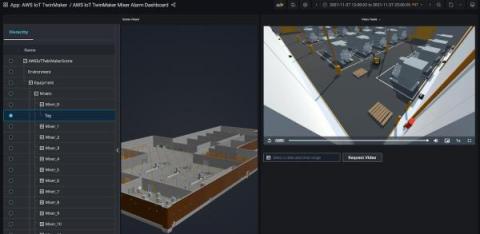
How Grafana powers the dynamic visualizations of IoT data for AWS IoT TwinMaker
At re:Invent this year, AWS announced its new digital twin service, AWS IoT TwinMaker (in preview), which allows users to create digital twins of real-world systems like buildings, factories, industrial equipment, and production lines. Using a digital twin to monitor and improve operations for a physical system requires ingesting data from IoT sensors, process instruments, cameras, and enterprise systems, and curating and associating data from these disparate sources.
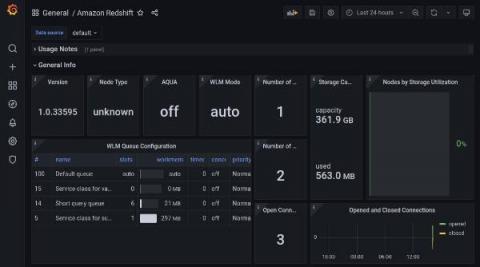
Monitor all your Redshift clusters in Grafana with the new Amazon Redshift data source plugin
In collaboration with the AWS team, we have recently released the new Redshift data source plugin for Grafana. Amazon Redshift is the fastest and most widely used cloud data warehouse. It uses SQL to analyze structured and semi-structured data across data warehouses, operational databases, and data lakes by using AWS-designed hardware and machine learning.

