How to Install Rancher Desktop on Linux
Nuno do Carmo gives an introduction to Rancher Desktop and show you how to install it on Linux.


The latest News and Information on DevOps, CI/CD, Automation and related technologies.
After many weeks of work, we're delighted to announce the latest feature of the incident.io platform: Workflows. Configure your processes once, and we'll make sure you follow them, every time ✨ A little while ago, I was asked the question: “what makes a good incident response?”. Whilst there’s infinite nuance in the answer, mine was pretty straightforward. The best incidents are founded on principles of communication, coordination, and clear roles and responsibilities.
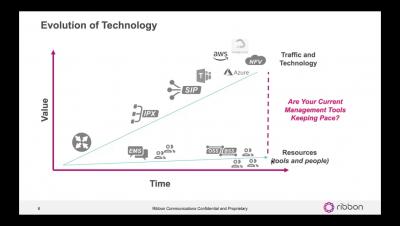
Technology is one of the main success factors for any organisation. A few decades ago, when technology (and life) were not as fast-paced as today, IT was more about keeping the lights on and maintaining business as usual operations. Today, the game has massively changed. On the roads that are ever-changing, innovation is what keeps the wheel spinning. If you think that the world is doing enough innovation today, then it would be very interesting to check the recent Growth & Innovation McKinsey report.
Have you heard about the Puppet Practice Labs? Our free, browser-based, hands-on labs cover a variety of topics for getting started with Puppet — everything from installing the primary server to identifying server roles using package data collection, and much, much more. You can read more about them in my previous blog post. We’ve designed Puppet Practice labs to make learning Puppet fun, engaging, and memorable for learners of all levels.
Epinio, the application development engine for Kubernetes, is meant to take you from app to URL in one step. It does that by either applying buildpacks to your app or using a pre-built docker image. Epinio installs into any Kubernetes cluster to bring your application from source code to deployment and allow for developers and operators to work better together.
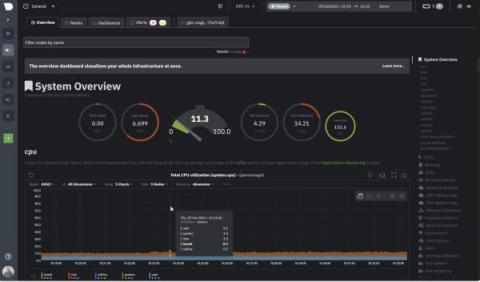
Netdata excels in collecting, storing, and organizing metrics in out-of-the-box dashboards for powerful troubleshooting. We are now doubling down on this by transforming data into even more effective visualizations, helping you make the most sense out of all your metrics for increased observability. The new Netdata Charts provide a ton of useful information and we invite you to further explore our new charts from a design and development perspective.