Operations | Monitoring | ITSM | DevOps | Cloud

From Feeding Families to Empowering Students: How Data Is Fueling Amazing Outcomes During COVID-19

We’re living history. We’ve heard it uttered in everything from news reports to conversations with loved ones. And it’s true — the tragedy and uncertainty of COVID-19 is shaping history and policy as we know it. But there’s something else newsworthy, too. Amid the pandemic, we’ve seen beacons of hope, humanity and progress. People have banded together to solve monumental problems at record pace.
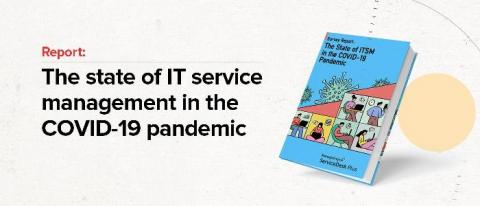

We studied how the pandemic has affected ITSM - here are the results

As the world moves towards the “new normal” on account of the pandemic, numerous adjustments and recalibrations have been made in all aspects of our lives, including the organizations we are part of. As businesses base their operations on a dispersed workforce beyond the corporate perimeter, IT teams have been the ones largely enabling this successful migration to home workspaces and further sustaining the remote network to foster productivity.

Nishant Singh shares his thoughts on being an SRE

Nishant Singh is an SRE at LinkedIn based in Bangalore. Currently, he is working towards building and maintaining applications that improve the overall MTTD (Mean time to detect) and MTTR (Mean time to recover) of the site. He likes to build services and play with the latest technologies. Before LinkedIn, Nishant worked for a few companies in the security and e-commerce domain as a DevOps engineer where he was primarily responsible for building infrastructure, deployment pipelines and security.

Introducing Versions API to Automate Error Response for New Code Versions

You know the feeling. You’ve just deployed a new version to production and are monitoring the Rollbar dashboard for any new errors or looking out for any Slack notifications. You’re keeping an eye on the number of new or reactivated errors, their severity level, and triaging to see which errors need to be assigned and to whom. Now what if you could automate these tasks?

Exporters and Target Labels

When monitoring third-party applications with Prometheus, you’ll need an exporter if the application doesn’t already expose metrics in the appropriate format. How do you find an appropriate exporter, and once you have your exporters, how should you organize your label taxonomies to reflect your infrastructure? Many applications in the systems you’re in charge of will be third-party applications, which do not natively expose Prometheus-formatted metrics.

How to apply for AWS Activate

AWS Activate is a program that provides startups with free AWS credits. There are specific requirements startups must meet in order to qualify, and not all startups that qualify end up receiving the free AWS credits. Still, for any startup planning on running their app in AWS, it’s probably worth a try. AWS Activate has two packages: the Founders package and the Portfolio package.

Secure Access to PostgreSQL with Pgweb

PostgreSQL is an open source database known for its reliability and performance. It’s used across many industries and applications, and is especially a favorite of web developers. All major web frameworks support PostgreSQL natively, from node.js and Django to Rails and Spring, so its adaptation is relatively broad across the internet for site backend systems. As with any database, developers need tools to work with them. Pgweb is an open source, web-based client for PostgreSQL.

Winning with Application Insights Logging

This article will focus on using Azure Application Insights to monitor the real-world business apps. Azure Application Insights is an Application Performance Management (APM) service for developers and DevOps professionals. It is used to monitor an app that is live in real-time. It supports a variety of platforms including .NET, Node.js, Java, and Python hosted on-premises, hybrid, or any public cloud. Application Insights can be used in two ways to monitor your Application.