Operations | Monitoring | ITSM | DevOps | Cloud

Optimizing costs in Elastic Cloud: Availability zones and snapshot management

Welcome to another blog in our series on cost management and optimisation in Elasticsearch Service. In previous installments, we looked at hot-warm architecture and index lifecycle management as ways of managing the costs associated with data retention and at managing replicas as a means of optimising the structure of your Elasticsearch Service deployment. Be sure to check out the other blogs in the series for additional tips to help you as you build out your deployment.

Telemetry Everywhere: Observability in the DevOps Cosmos

Rockets constantly blast off into space headed towards planets, aiming to create shiny new stars, while meteors whizz by them, threatening their journeys. That’s how global DevOps expert Helen Beal describes the complicated and risky universe of DevOps practitioners and SRE teams. The rockets are these teams’ frequent code releases. Planets represent customers that benefit from the value — stars — created by these launches.

The Cloud - A sellers' perspective on a hot topic.

I have worked at Virtana for nearly 9 years. During that time, I have had the pleasure to interact with customers, prospects, and partners around the world. The types of conversations I have participated in have dramatically shifted during that time. Back in September 2011, the dialogues were largely focused on Storage Area Network (SAN) infrastructure, and how Virtana could provide performance assurances targeted at this environment. Over time, the conversations have broadened dramatically.

Sumo Logic Achieves FedRAMP-Moderate "In Process"

Sumo Logic is taking the next step towards Moderate authorization under the Federal Risk and Authorization Management Program (FedRAMP). Today Sumo moved from “Ready” to “In Process” on the FedRAMP Marketplace, an important step toward expanding our ability to serve U.S. governmental agencies. Sumo Logic expects to achieve FedRAMP-Moderate Authorization quickly while working closely with the Federal Trade Commission (FTC) as our agency partner.

August 2020 Update: Manage service and system categories in the web portal and define responsibilities centrally

Our August update now makes it easy to assign team responsibilities for individual systems through our categories. This is no longer only possible by each team member in the mobile app, but can now also be done centrally in the web portal by the team administrator. All details can be found in this blog article.

How to use Hardware Asset Management for Recording Keeping

In the life of a hardware asset, there is only one point when we know for sure we have what we purchased: When we first receive the asset. This hardware asset scenario reminds me being a little kid and playing catch with my neighbor. I would take a new baseball out of the package and throw it over the fence to him. He would catch it and then throw it back. Sometimes he would try to trick me and throw a different ball back over the fence: an old baseball, a softball, and one time a soccer ball.

How to Use Starlark with Telegraf

Our Telegraf Starlark Processor Plugin is an exciting new processor in Telegraf 1.15 that gives you the flexibility of performing various operations in Telegraf using the Starlark language. What is Starlark, you ask? Starlark (formerly known as Skylark) is a language intended for use as a configuration language. Starlark is a dialect of Python. Like Python, it is a dynamically typed language with high-level data types, first-class functions with lexical scope, and garbage collection.

Java Logging Best Practices: 10+ Tips You Should Know to Get the Most Out of Your Logs

Having visibility into your Java application is crucial for understanding how it works right now, how it worked some time in the past and increasing your understanding of how it might work in the future. More often than not, analyzing logs is the fastest way to detect what went wrong, thus making logging in Java critical to ensuring the performance and health of your app, as well as minimizing and reducing any downtime.

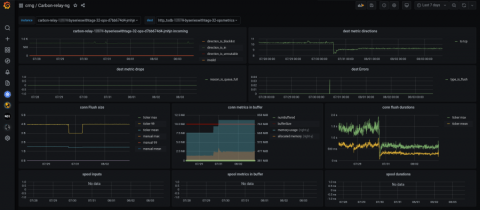
How to stream Graphite metrics to Grafana Cloud using carbon-relay-ng

In this post we’ll show how you can easily ship your existing Graphite metrics to Grafana’s managed metric offering using carbon-relay-ng. Carbon-relay-ng is a fast, go-based carbon-relay replacement that allows you to easily aggregate, filter and route your Graphite metrics. This post assumes you have a local carbon-relay-ng binary. You can download carbon-relay-ng binaries from the releases page and find documentation on Docker images, Linux packages, and how to build it yourself here.

Asynchronous CSV Exports with Discover

For as long as we can remember, Sentry has had some version of CSV Exports. They’ve been limited only 1000 rows of results, which did the job for the most part. However, the more you used Sentry, the more we found that limit wasn’t good enough. What if I told you there was a way to get all your data in the exports in a single CSV? That’s right, no more DIY python scripts. No more manually piecing CSVs together. No more feature-request tickets.