Introduction to SquaredUp
A brief introduction to the challenge of observability data being spread across the organisation, and how SquaredUp's data mesh approach can help to leverage your existing tools to deliver consolidated insight.


The latest News and Information on Monitoring for Websites, Applications, APIs, Infrastructure, and other technologies.
This is part 2 of a 3-part series on profiling. If you’re not yet familiar with the what profiling is, check out the first part in our series. By this point, you’re probably already convinced that good performance is important for your app’s success. There are many tools available for performance, but profiling in production with a modern profiling tool is one of the easiest and most effective ways to get a full understanding of your app’s performance.
When adding new Checks in Checkly a number of locations are available to check your endpoints from multiple locations around the world. For most use cases this is more than enough to ensure your resources are online. However, these locations are outside of your network and are unable to check on resources deployed more securely inside your private network.
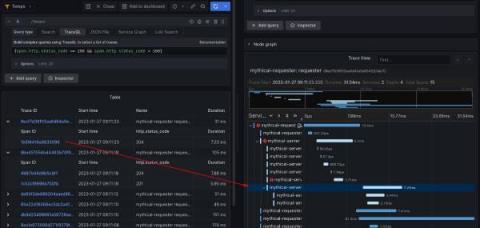
At Grafana Labs, we love tracing, which is why we’ve been hard at work on Grafana Tempo, an open source, highly scalable distributed tracing backend. Tempo just had its 2.0 release. In conjunction with that release, we are excited to show off TraceQL — a powerful new query language designed for distributed tracing. In this blog, we’ll provide an overview of why we created TraceQL, how it works, how you can put it to use today, and what we have planned for future iterations.
If you're using Oban for managing background jobs in your Elixir application and want to gain a deeper data-driven understanding of how they perform, you've come to the right place. AppSignal for Elixir now automatically instruments Oban, meaning you can now monitor the performance of your background jobs through an AppSignal Magic Dashboard, which gives you detailed information on queue times, processing times, and notifies you of any exceptions.
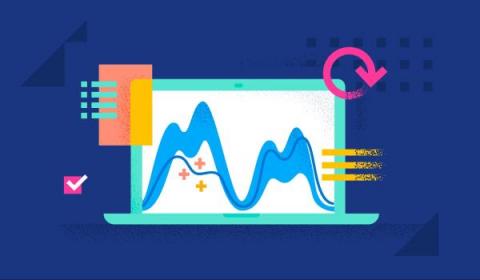
With more and more applications moving to the cloud, an increasing amount of telemetry data (logs, metrics, traces) is being collected, which can help improve application performance, operational efficiencies, and business KPIs. However, analyzing this data is extremely tedious and time consuming given the tremendous amounts of data being generated. Traditional methods of alerting and simple pattern matching (visual or simple searching etc) are not sufficient for IT Operations teams and SREs.
OpenTelemetry is an open-source observability framework that provides a vendor-neutral and language-agnostic way to collect and analyze telemetry data. This tutorial will show you how to integrate OpenTelemetry with Amazon AWS Fargate, a container orchestration service that allows you to run and scale containerized applications without managing the underlying infrastructure.
Kubernetes has come a long way, but the current state of Kubernetes open source monitoring is in need of improvement. This is in part due to the issues related to an unnecessary volume of data related to that monitoring. For example, a 3-node Kubernetes cluster with Prometheus will ship around 40,000 active series by default. Do we really need all that data?