Operations | Monitoring | ITSM | DevOps | Cloud

The latest News and Information on Monitoring for Websites, Applications, APIs, Infrastructure, and other technologies.

The Importance of Application Performance Monitoring.

In this digital era, applications are used on a daily basis to make our life easier. A lot of software applications are launched every day, continuously increasing competition in the market. There are thousands of applications available for a task. But, the success of any application highly depends on its performance. A good-performing application provides a flawless user experience to the customers. Ultimately, making performance a crucial metric for benefitting the company owning the software product.

Digitalization Challenge the future with Pandora FMS

Pandora FMS unifies information on all systems, from all departments and environments in a single console, coordinating efforts and presenting useful information to the appropriate person, at the right time. Your IT infrastructure shouldn't feel out of your control when it relies on external provider services. We don't just provide a product, we integrate a solution and engage with our customers from start to finish by executing successful projects.

Dashboard Fridays: Sample UptimeRobot Dashboard

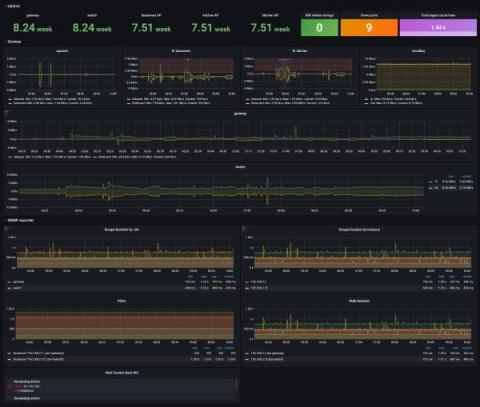
Join Adam Kinniburgh and Ashley Thompson as they showcase this example UptimeRobot Dashboard. Built in SquaredUp with the powerful WebAPI tile, this dashboard gives an overview of monitoring configured using UptimeRobot’s website monitoring features. Query UptimeRobot for information about your web tests, summarize them, and create a slick UptimeRobot dashboard in SquaredUp. This is an example of querying the web test data, though the other data sets are equally easy to pull in!

Monitoring & Observability for Sales, Marketing and Business ops teams with StackMoxie and PagerDuty

Before Stack Moxie, every business ops team needed PagerDuty, but finding and pushing errors was a manual process. With Stack Moxie + PagerDuty, every business op professional can manage their sales, marketing, HR or customer success stack with the same quality engineers bring to code.

How to set up Stanza as the log agent for your GCP?

Stanza is a robust log agent. GCP users can use Stanza for ingesting large volumes of log data. Before we dive into the configuration steps, here’s a matrix detailing the functional differences between all the common log agents used by GCP users. Stanza was built as a modernized version of FluentD, Fluentbit, and Logstash. GCP users now have the ability to install Stanza to their VMs/ GKE clusters to ingest logs and route them to GCP log explorer.

Implementing SLAs, SLIs, and SLOs in an observability suite

Implementing SLAs, SLIs, and SLOs in an observability suite is now business-critical. Over time, a company’s decision-makers can add a burdensome number of KPIs that force servers and other IT assets to devote excessive processing time to business intelligence. Eventually, the burden becomes so great that employees, managers, and executives start to complain about the system’s sluggishness. Developers know that they need to strike a balance between business needs and IT processes.

Ask Miss O11y: I Don't Want to Be On Call Anymore. Am I a Monster?

First, I’d like to say that pager duty isn’t something we should treat like chronic pain or diabetes, where you just constantly manage symptoms and tend to flare-ups day and night. Being paged out of hours is as serious as a fucking heart attack. It should be RARE and taken SERIOUSLY. Resources should be mustered, product cycles should be reassigned, until the problem is fixed.