Operations | Monitoring | ITSM | DevOps | Cloud

The latest News and Information on Monitoring for Websites, Applications, APIs, Infrastructure, and other technologies.

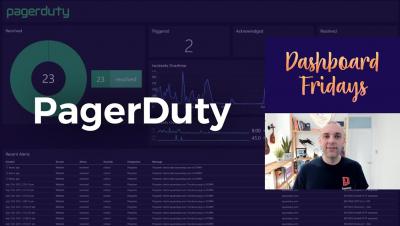
PagerDuty Integration Spotlight: InfluxData

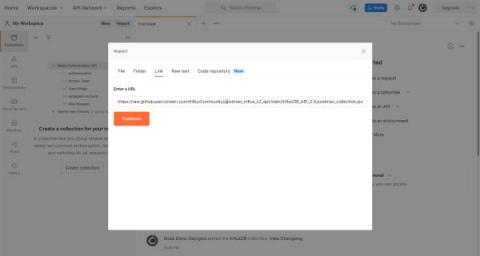
InfluxData is an Open Source Platform built for metrics and events — a platform that is purpose-built for time series data. The essential time series toolkit — dashboards, queries, tasks and agents all in one place. InfluxDB is even more programmable and performant with a common API across OSS, cloud and enterprise editions. Send events to PagerDuty to keep your teams informed. Check out InfluxData’s integration.

Facebook, Instagram, and Whatsapp's Outage - Understanding MTTR

Yesterday the most used social media platforms in the world were inaccessible for 6 hours straight. Later, in a press release, Facebook revealed that the outage was due to configuration changes in their routers. There is no doubt that Facebook has an intense incident response plan, yet a small blind spot resulted in a significant business interruption. So how do we avoid this? The truth is, outages and performance issues are bound to happen in any network.

The Future of AIOps Includes an ITOps Strategy

One of the questions I get asked a lot by customers, prospects, and partners is, “Will AIOps make them irrelevant?” To them, AIOps is often equivalent to automated remediation; an AIOps system automatically detects an incident and kicks off a remediation process in response to this incident, knowing exactly what process will solve the problem. IT is out of the loop, data centers and NOCs just keep humming along unattended, end users are none the wiser.

Facebook, Instagram, and WhatsApp Down for Over Five Hours

Did you unconsciously open Instagram, Facebook, or WhatsApp several times throughout the day on Monday, only to get a “Couldn’t refresh feed” message? Did you try again every 20 or so minutes? Did you maybe even restart your phone, not once thinking websites as large as Facebook could possibly go down and believing it must be your own technology? Rejoice: it’s not you, it’s them.

Reliable Alerting with Icinga and SIGNL4

You’ve probably been in this situation before – you’re using Icinga to monitor your infrastructure and Icinga detects a critical issue but nobody notices it. It might be an urgent maintenance request, an unexpected breakdown, or a service quality issue. But your technicians or service engineers are neither in the control room nor in front of the dashboard to see the issue and its urgency.

Announcing General Availability of the Honeycomb Query Data API

The Query Data API is a Honeycomb Enterprise feature. With a Honeycomb Enterprise account, you can use this API today. Head over to our API docs to learn how to get access to your data. If you aren’t yet a Honeycomb Enterprise user, try it out by requesting an Enterprise Trial. Starting today, Honeycomb Enterprise customers can use the Honeycomb Query Data API to programmatically run queries and retrieve their results, and pull query results into any data visualization tool of their choice.

Elastic Observability: Driving mean time to resolution to zero

At ElasticON Global 2021, Tanya Bragin, VP Product, Observability, and the Elastic Observability team showed how ongoing innovations continue to deliver actionable insights and faster root cause detection, reducing mean time to resolution (MTTR). The adoption of cloud, microservices, and ephemeral infrastructure is driving increased complexity, requiring an observability solution to provide end-to-end visibility.