Operations | Monitoring | ITSM | DevOps | Cloud

The latest News and Information on Monitoring for Websites, Applications, APIs, Infrastructure, and other technologies.

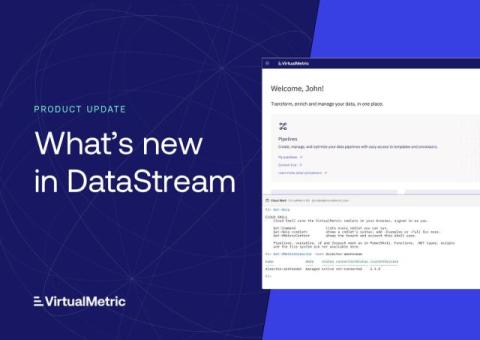
Cloud Shell, New Integrations, and More

VirtualMetric DataStream now includes a PowerShell console in the browser, more than a dozen new integrations, and a new way to collect data from servers and virtualization hosts, where teams choose exactly what they collect. This update also brings guided learning for new users, built-in monitoring rules, and new controls for organizations managing branding and sign-in. Here’s what’s new.

Monitor warehouse data quality beyond pipeline health

You get a Slack message from the VP of Sales: They have asked an AI agent connected to Snowflake for the past quarter’s revenue and the numbers look wrong. First, you verify the agent’s query and, when that looks fine, check the pipelines that populate the underlying table. All jobs completed, the data is recently refreshed. Then it’s time to check the logs for errors. Nothing.

Dr. Cat Hicks on the Psychology of Software Teams

What happens when a software engineer who has put their entire identity into being the resident expert of an obscure technology or language with ten years of experience and who knows the codebase like the back of their hand now has to compete with AI? Psychologically speaking, according to Dr. Cat Hicks, author of The Psychology of Software Teams and founder of Catharsis, that's called identity threat, and it's a surefire way to feel unsafe. We were honored Dr.

OnlineOrNot updates from June through August 2026

It's been a while since I last updated you on what's new in OnlineOrNot. For the most part, I've continued making it useful for software teams: there's now an MCP server, I've improved the terraform provider significantly, and there's a new TypeScript SDK. You can also (finally?) monitor DNS/TCP with it.

Best Monitoring Tools With MCP Servers for AI Coding Agents (2026)

Your AI coding agent can read your code, run your tests, and open a pull request. Until recently it could not see what that code does in production. MCP servers from monitoring vendors close that gap. Connect one, and Claude Code, Cursor, or Copilot can pull the error, the trace, and the slow query behind a bug report without you copying anything out of a dashboard. Most major monitoring vendors now offer an official MCP server. But they aren’t interchangeable. Some only expose errors.

Grafana Mobile to Desktop Companion App

The Grafana Mobile App lets you triage alerts with help from Assistant from your phone. You can declare an incident or trigger an investigation into an incident in order to get more information so that by the time you get to your desktop, everything is ready for you. Grafanistas Ignacio and Florian go through a use case deep dive, demonstrating the value of the Grafana Mobile Companion app by triggering an investigation, talk to Assistant, and have all the data you need to resolve an incident - all from your phone.

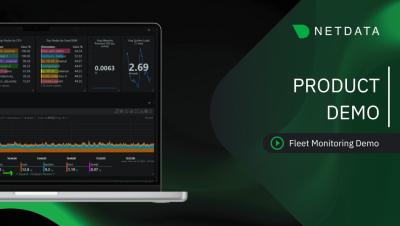
Fleet Monitoring with Netdata: Live Demo

A walkthrough of monitoring a distributed fleet with Netdata, using a simulated fleet of about 1,000 devices spread across regions. We show how the whole fleet reports into a single view: per-second metrics from every node, grouping by region and by customer, a map view that colors each device by health, filtering and saved views for different teams, and an AI-assisted investigation that scans the fleet for anomalies and points to likely causes.

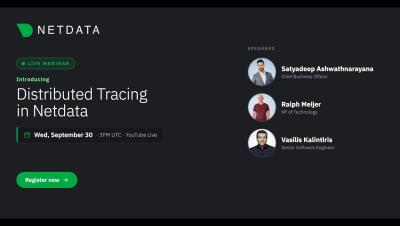
Introducing Distributed Tracing in Netdata

Netdata now supports distributed tracing. In this webinar, we'll demo the new tracing capabilities for the first time: OpenTelemetry trace ingestion, the new tracing dashboard, and the UI built to let you move from a metric anomaly to the exact span that caused it. For years, teams have asked us to close the gap between infrastructure monitoring and application performance. This release does that. Netdata can now ingest traces via OTEL, correlate them with the metrics and logs you already collect, and surface them in a purpose-built interface designed for speed and clarity.

How to Make Claude Your UI Design Companion

When I first tried Claude Design, shortly after it was released, I wasn’t impressed. As an every day Figma user, I missed the option to manipulate elements directly, especially for fine tuning details. What I overlooked at that point was the fact that it is really good at generating different options efficiently. Most of them aren’t usable, but getting these options suggested helps when exploring and combining different approaches and ideas.