Operations | Monitoring | ITSM | DevOps | Cloud

The latest News and Information on IT Networks and related technologies.

Is Your MSP Pricing Model Inhibiting Your Business Growth?

One of the questions MSP owners ask most often isn’t about tools or tech. It’s about pricing. Not just what to charge, but something closer to, “Is the way I’m charging actually built to support where I want this business to go?” We’re going to dig into why pricing models matter just as much as service delivery, how the most common approaches help or hurt as MSPs scale, and what to look at when margins feel tighter than they should.
How to Check Bandwidth Usage Across Your Network

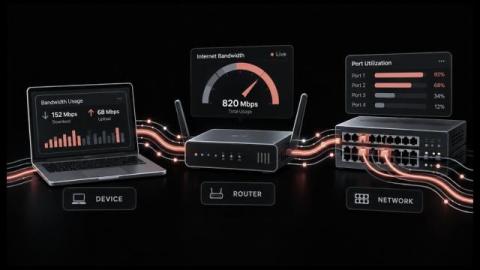
Most bandwidth problems get investigated after the complaints arrive, and by then the traffic that caused them has moved on. The numbers you need sit in several places at once. A laptop knows its own traffic. The router knows what leaves for the internet, and only the switches see how much network bandwidth moves inside the building. Checking bandwidth usage at the right layer saves hours of guessing. Most of the methods ship with hardware you already own.

What is a CRC Error and How to Find the Faulty Link Before It Slows the Business

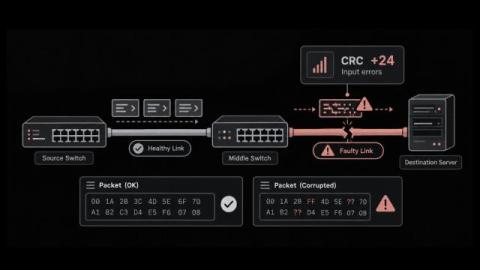
Why does a switch port look healthy on every dashboard while people on that floor keep reporting dropped calls and slow file transfers? Often the cause is CRC errors, a port counter that most dashboards do not show by default. Each CRC error means a unit of data arrived damaged and the switch discarded it. Put simply, a CRC error tells you the receiving device noticed the data changed somewhere in transit.

The Human Side of Innovation: Sheetal Kalra on Trust, Simplicity, and SolarWinds in Africa

"Channel is the heartbeat of any vendor conversation...if your product is not good, the channel is not going to be doing the miracle." In this episode of SolarWinds World Tour Conversations, we sit down with Sheetal Kalra, Regional Channel Manager for META, to discuss why a strong channel ecosystem is essential for bringing in strong customers. We explore the technology-driven nature of channel sales, the 2026 modifications to simplify the Partner Program, and how partners are successfully navigating network and observability challenges for their clients.

ITSM to Deep Observability with ServiceOps & ObserveOps | Motadata Webinar

In this webinar recording, discover how ServiceOps and ObserveOps connect IT service management with deep observability. Learn how IT teams can identify root causes faster with unified visibility across incidents, metrics, logs, traces, applications, and infrastructure. Don't forget to like, share, and subscribe for more insights on ITSM, observability, AIOps, and IT operations.

Best Practices for Effective Healthcare Networks

An effective healthcare network is the IT infrastructure that keeps clinical and operational services reachable, responsive and diagnosable across hospitals, clinics, imaging centers, laboratories, remote sites, cloud services and vendor connections. A device can be up while Electronic Health Record (EHR) access, Picture Archiving and Communication System (PACS) retrieval, telehealth or a wireless clinical workflow is still slow or unavailable.

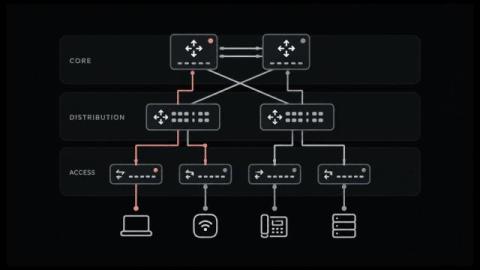
What Is a Network Topology Diagram? Types, Examples and How to Build One That Stays Current

Most network diagrams are accurate exactly once: the day they are finished. The network keeps changing, the drawing does not, and the gap shows up during the next outage. According to the Uptime Institute Annual Outage Analysis 2026, failure to follow established procedures remains the leading driver of human-error outages. A wrong diagram is how a right procedure hits the wrong port. The fix is a network topology diagram that matches the live network topology.

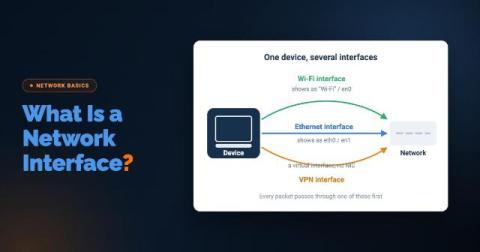
What Is a Network Interface (and Why Your Monitoring Tool Should Care)

A user opens a ticket: "The Internet is slow." IT checks the network. Bandwidth looks fine, no outages, no alerts firing. They check with the ISP, but nothing on their end either. Everything upstream checks out, and yet the user is still stuck watching a spinning wheel. What rarely gets checked is the one component sitting closest to the problem: the machine's own network interface.

Upgrading the Operations Tech Stack at the Edge of Supply Chains

Warehouse management systems (WMS) and resource planning (ERP) platforms have undergone massive architectural shifts over the last decade. Microservices, event-driven cloud architectures, and real-time database synchronization have transformed how logistics organizations manage inventory levels, calculate safety stock, and track order fulfillment. Yet, despite millions invested in core IT infrastructure, operations architects frequently encounter a persistent data blind spot at the physical perimeter of the supply chain network: the loading dock.