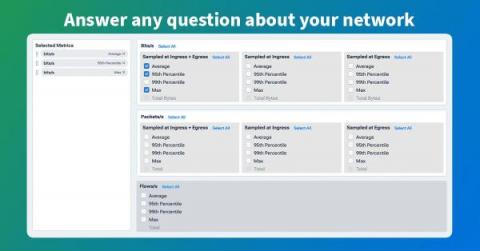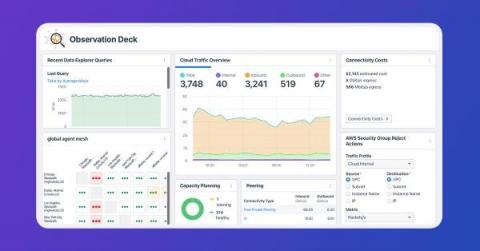
A cornerstone of network observability is the ability to ask any question of your network. That means having an unbound capacity to explore the tremendous amount and variety of network telemetry you collect. It means seeing trends and patterns from a macro level, but it also means getting very granular to pursue any line of analysis of your data. Collecting information from flow records, SNMP, streaming telemetry, BGP, eBPF, and so on is indeed very important.

Meeting bandwidth capacity needs of customers is a crucial business objective for today’s providers. While both coarse wavelength-division multiplexing (CWDM) and dense wavelength-division multiplexing (DWDM) are modern forms of wavelength-division multiplexing (WDM) that effectively solve those increasing bandwidth needs by upgrading the utilization of new and existing fiber, they are each designed to tackle different network challenges.
Everyone is shifting their workloads to the cloud, but one challenge remains: Workloads need to be automated. Whether they’re employing a cloud-native, cloud server, or hybrid model—IT operations teams need to know what, when, and now also where to automate. Speaking at the recent 2022 Automation Virtual Summit, Dave Kellermanns, Global Advisor for Automation, Broadcom Software explored some lessons learned and best practices for cloud automation. Read on to see some of the highlights.
Last summer we teamed up with the New York Times to analyze the re-routing of internet service to Kherson, a region in southern Ukraine that was, at the time, under Russian occupation. In my accompanying blog post, I described how that development mirrored what took place following Russia’s annexation of Crimea in 2014.
The risk from insider threats has grown massively, with perpetrators frequently getting around organizations' increasingly complex perimeter protections. It is one of the most common ways customer data or industrial and trade secrets leak. This very complex topic includes many types of threats and techniques. Let's discuss how you could detect insider threat activity at a network level.
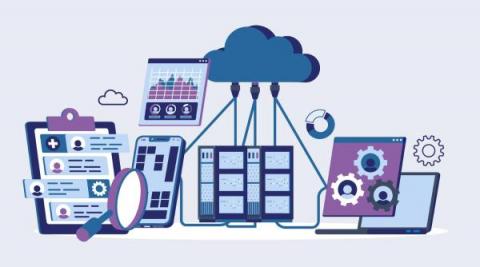
Cloud networking is the IT infrastructure necessary to host or interact with applications and services in public or private clouds, typically via the internet. It’s an umbrella term for the devices and strategies that connect all variations of on-premise, edge, and cloud-based services.
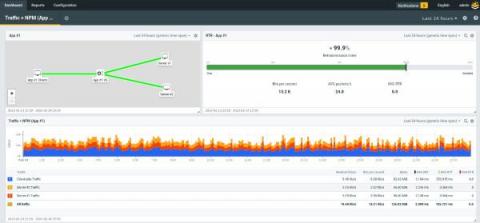
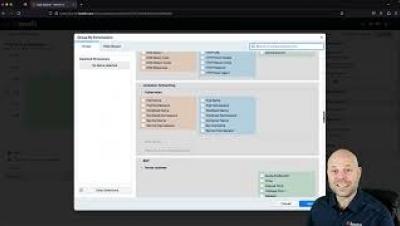
The Loadmaster Network Telemetry feature makes it easier than ever to get key insights on your applications into your Flowmon deployment. By creating both cluster-wide and application specific channels you can quickly build NPM dashboards and topologies that surface essential performance and availability metrics broken down by application, client and server.
For DX Unified Infrastructure Management (DX UIM) customers, upgrading to the latest release has significant benefits – and that’s especially true with the latest version, release 20.4 cumulative update 6 (DX UIM 20.4 CU6). It offers a significant number of enhancements and new capabilities. DX UIM 20.4 CU6 provides teams with several advantages, including enhanced accessibility, improved operational efficiency, and richer insights.
For teams running secure web gateways (SWGs), also referred to as proxies, in today’s complex, dynamic network environments, extensive observability is a must have. Symantec offers a range of flexible deployment options for its SWGs, offering support for cloud, edge, and hybrid approaches. This blog explores a Broadcom solution that provides comprehensive observability for the Symantec edge offering, Symantec Edge SWG (formerly ProxySG).
In recent years, the rapid development of cloud-based networking, network abstractions such as SD-WAN, and controller-based campus networking has meant that basic, day-to-day network operations have become easier for non-network engineers. The result we’re starting to see today is a sort of consolidation of networking tasks, leading to a need for only a small number of highly skilled network engineers to handle the less frequent heavy lifting of advanced design and troubleshooting.
As hybrid and remote work continues to become the norm for businesses of all sizes, organizations are increasingly gravitating to cloud-based unified communication tools to boost internal collaboration and stay connected to customers. Microsoft Teams is already one of the most popular choices for chat and meetings and it is becoming a popular tool to use as a cloud-based business phone system.
In today’s digital world, data is generated faster and at a larger scale than ever before. With software architectures increasingly adopting distributed, cloud-based models, network infrastructures have become complex webs of virtual and physical devices.
“The Internet (or Internet) is the global system of interconnected computer networks that uses the Internet protocol suite (TCP/IP) to communicate between networks and devices. It is a network of networks that consists of private, public, academic, business, and government networks of local to global scope, linked by a broad array of electronic, wireless, and optical networking technologies.
An Azure Load Balancer is a Layer-4 (TCP, UDP) load balancer that provides high availability by distributing incoming traffic among healthy VMs. A load balancer health probe monitors a given port on each VM and only distributes traffic to an operational VM. Azure Load Balancers are frequently used in Azure Virtual Desktop (AVD) deployments. From our work with Azure Load Balancer, we think there are 4 key metrics and events you should proactively monitor and alert on.
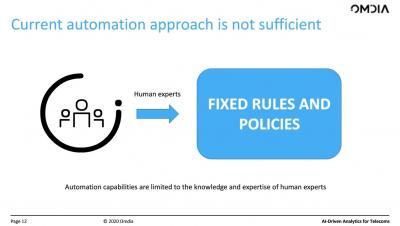
Even in the most structured environments with clear operational strategies, complexity build-up in infrastructure and operations is unavoidable as businesses grow. To help these environments thrive in a consistent, reliable way, it’s vital to optimize the IT function: the backbone that supports every business application and ensures service excellence across all other functions. Automating operations is the only way for IT to scale and support today’s business demands.
Check Point’s 2022 Workforce Security Report states that more than half of the workforce works remotely in 57% of organizations. The increase in the number of employees that work from home brings up new security implications that on-premise IT environments didn’t have to worry about. As organizations continue to undergo digital transformation, the existing network and network security architectures no longer meet the needs of the current digital era.
Telecommunication organizations need to ensure they have the necessary resources and technology to maintain service uptime SLAs. Increased regulations and emerging technologies forced telecommunications companies to evolve quickly in recent years. These organizations’ engineers and site reliability engineering (SRE) teams must use technology to improve performance, reliability and service uptime.
On any given day, network administrators have to contend with significant challenges. They often struggle with key questions: How do I ensure I’m spotting traffic anomalies? How do I use our resources most efficiently? How can I intelligently plan for network capacity upgrades? By employing network flow monitoring, administrators can gain accurate insights into these topics.
Network monitoring is a critical aspect of managing and maintaining the performance and security of a network. It includes monitoring and analyzing network traffic, devices, and systems to identify potential issues and ensure that the network operates efficiently and effectively. Network monitoring can help organizations identify and prevent security breaches, identify and troubleshoot performance issues, and ensure compliance with industry regulations and standards.
Traffic telemetry is the data collected from network devices and used for analysis. With traffic telemetry, engineers can gain real-time visibility into traffic patterns, correlate events, and make predictions of future traffic patterns. As a critical input to a network observability platform, this data can help monitor and optimize network performance, troubleshoot issues, and detect security threats. However, traffic telemetry can be difficult to understand.
For the sake of security, performance and uptime, IT pros must find problems on the network immediately and fix them fast. Hmm. Sound like network detection and response (NDR)? It is.
In an ideal world, organizations can establish a single, citadel-like data center that accumulates data and hosts their applications and all associated services, all while enjoying a customer base that is also geographically close. As this data grows in mass and gravity, it’s okay because all the new services, applications, and customers will continue to be just as close to the data. This is the “have your cake and eat it too” scenario for a scaling business’s IT.
How can enterprises streamline their operations for improved internal efficiency and customer satisfaction? The right combination of DevOps tools will do just that.
In the early hours of Wednesday, January 25, Microsoft’s public cloud suffered a major outage that disrupted their cloud-based services and popular applications such as Sharepoint, Teams, and Office 365. Microsoft has since blamed the outage on a flawed router command which took down a significant portion of the cloud’s connectivity beginning at 07:09 UTC.
From traditional “brick and mortar” data centers to virtual data centers, we explain the various use cases this facility provides within your enterprise network.
Imagine starting your car in the morning and having your attention captured by a little red check engine light. After expressing frustration in your own unique way, your next objective is to determine why this little light has brought darkness to your morning. Your owner's manual clearly outlines how to operate and routinely maintain your vehicle, but all you know about this little light is that you’ll soon be meeting your local mechanic.
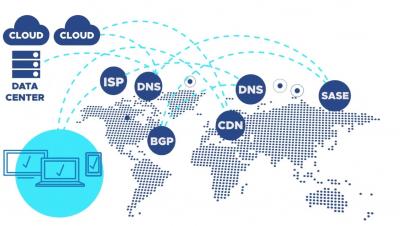
Network observability is critical. You need the ability to answer any question about your network—across clouds, on-prem, edge locations, and user devices—quickly and easily. But network observability is not always easy. To be successful, you need to collect network telemetry, and that telemetry needs to be extensive and diverse. And once you have that raw telemetry data, you need to interpret it.