IT analytics in 90 seconds: Track your performance against help desk targets
Measure resolution rates against help desk targets to identify how far you're off target and improve overall resolutions using Analytics Plus reports.


One of the world’s leading bed banks – a wholesaler of hotel allocations to B2B and B2C clients – recently experienced a surge in bookings. Great news, right? Not really. A glitch caused room prices from one of their hotel suppliers to drop from $100+ per night to JUST $8. Imagine how much this glitch could have cost them if left unchecked.
Glitches happen. Even to the best of us. And rather than promote others’ misfortune, we created this list to highlight the importance of anomaly detection – and as a warning against denial. Because if it can happen to the world’s most-recognized companies, it can certainly happen to you.
The pace in which new releases of the Elastic Stack are being rolled out is breathtaking. Just two weeks after Elastic Stack 6.7 was announced, versions 7.0 of Elasticsearch, Kibana, Logstash and Beats have been released full of new features and improvements.
SevOne, a 14-year-old company in the network monitoring space, started using Grafana for self-monitoring last year because there weren’t many frontend engineers in the organization at the time. “We fell in love with it,” SevOne Tech Lead Sean Lafferty said during his GrafanaCon talk about how the company live streams Grafana data sources.
Entity extraction is, in the context of search, the process of figuring out which fields a query should target, as opposed to always hitting all fields. The reason we may want to involve entity extraction in search is to improve precision. For example: how do we tell that, when the user typed in Apple iPhone, the intent was to run company:Apple AND product:iPhone? And not bring back phone stickers in the shape of an apple?
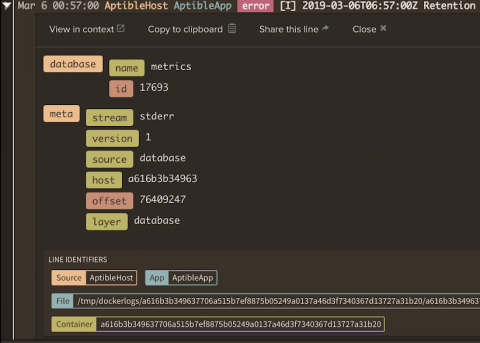
We’re happy to announce that forwarding your Aptible logs to LogDNA is much simpler than before. Aptible Enclave is a container orchestration platform built for developers that automates security best practices and controls needed for deploying and scaling Dockerized apps in regulated industries.
In Parts One and Two of this blog, we looked back at the ongoing open source licensing wars, focusing on the evolving situation between Elastic N.V. and AWS. In this final installment, we’ll offer some opinions on the situation, as well as share our own views on how we’re reacting at Grafana Labs.