Operations | Monitoring | ITSM | DevOps | Cloud

The latest News and Information on DevOps, CI/CD, Automation and related technologies.

How to get a phone call when your cron job fails

Learn how you can get a phone call alert when your cron job fails. Spike.sh sends you alerts via phone call, SMS message, email and Slack when you have any issues in production. Spike.sh integrates with your infrastructure, performance monitoring, error tracking, uptime monitoring, API monitoring and cron job monitoring tools. Our integrations include AWS, Google Cloud, Datadog, Grafana, Prometheus, New Relic and many more.

How to get a phone call when your API fails

Learn how you can get a phone call alert when your API fails. Spike.sh sends you alerts via phone call, SMS message, email and Slack when you have any issues in production. Spike.sh integrates with your infrastructure, performance monitoring, error tracking, uptime monitoring, API monitoring and cron job monitoring tools. Our integrations include AWS, Google Cloud, Datadog, Grafana, Prometheus, New Relic and many more.

New year, New York, new CivoStack

When we first started our managed Kubernetes beta, we knew utilising K3s as the Kubernetes distribution of choice was the right move. Not only is it light-weight and quick to deploy, K3s has features ideally suited for the scenarios we envisioned our users would encounter. It’s important for us to make sure any service we offer is 100% compatible with industry standards, and K3s allows us to do just that but with simplicity and speed for our users.

What is MEF 3.0 and why it matters

You may have spotted some news last week from PCCW Global that both its international network and the Console Connect digital platform have recently received MEF 3.0 certification. Besides demonstrating to our customers and partners that Console Connect is aligned with the latest and highest network standards, this news also highlights the work that we are doing behind-the-scenes to help advance network automation and on-demand services globally. Read more…

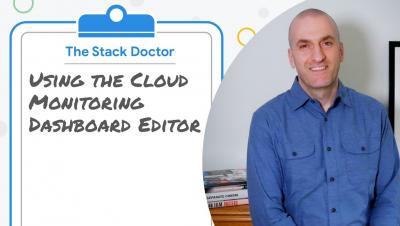
Using the Cloud Monitoring Dashboard Editor

Want to visualize your monitoring data like never before? In this episode of Stack Doctor, we show you how to use the new Dashboard Editor to easily visualize your Cloud Monitoring data. Specifically, we’ll show you how to create a dashboard using gauges, scorecards, and text widgets and how you can utilize the new layouts and chart configuration modes to closely monitor the health of your services!

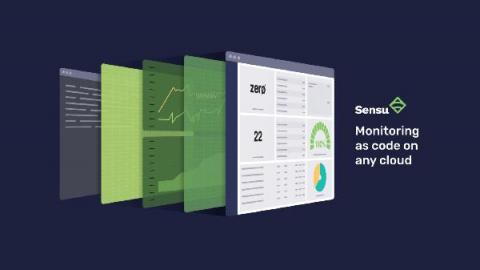
Monitoring as code: what it is and why you need it

“Everything as code” has become the status quo among leading organizations adopting DevOps and SRE practices, and yet, monitoring and observability have lagged behind the advancements made in application and infrastructure delivery. The term “monitoring as code” isn’t new by any means, but incorporating monitoring automation as part of an infrastructure as code (IaC) initiative is not the same as a complete end-to-end solution for monitoring as code.