Operations | Monitoring | ITSM | DevOps | Cloud

The latest News and Information on Monitoring for Websites, Applications, APIs, Infrastructure, and other technologies.

How to Monitor Your Hybrid Applications Without Toil

About seventy-two percent of businesses operate in a hybrid IT environment, mixing their cloud-based services with traditional on-premises infrastructure. These hybrid environments offer many benefits, from scale, speed, and flexibility to security, cost savings, and control, blending the best of both worlds.

Grafana 10.2.3 release: new features and breaking changes

On Dec. 18, 2023, we unintentionally introduced some new features and two minor breaking changes in the Grafana 10.2.3 patch release. These changes were originally intended for Grafana 10.3, which we plan to release later this month, but these commits were merged into the 10.2.3 release branch early due to a mistake in our release process. Because Grafana 10.2.3 introduces more changes than expected in a typical patch release, there’s a risk of more bugs than expected.

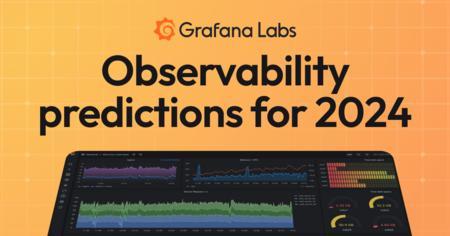
Observability trends and predictions for 2024: CI/CD observability is in. Spiking costs are out.

From AI to OTel, 2023 was a transformative year for open source observability. While the advancements we made in open source observability will be a catalyst for our continued work in 2024, there is even more innovation on the horizon. We asked seven Grafanistas to share their predictions for which observability trends are on their “In” list for 2024. Here’s what they had to say.

What is Observability? Monitoring vs Observability

When the process of an application malfunctions, it can have a negative impact on users and the business. Companies need a way to identify and resolve the root cause of problems smartly. This is where monitoring and observability come in. Monitoring and observability are two methods for identifying the underlying cause of problems. Observability in IT is a concept that goes further than simple monitoring.

Mastering NGINX Monitoring: Comprehensive Guide to Essential Tools

NGINX, is a versatile open-source web server, reverse proxy, and load balancer, stands out for its exceptional performance and scalability. Monitoring Nginx is pivotal for maintaining its optimal functionality. By tracking and analysing performance, including real-time insights into server health, resource utilization, and user requests, administrators can proactively identify issues.

The Role of Observability in Media and Entertainment

Digital transformation is at the core of media and entertainment organizations, it’s vital for these firms to constantly evolve to provide the best user experience to their customers. These companies must seek new and interesting content, services, and tailored offerings that enhance the audience’s experience and supply personalization. However, whilst these investments are essential to remain competitive, they’re also particularly costly.

Elevating Banking Excellence: Anodot's Real-Time Monitoring Revolution

As banks grapple with technical glitches causing service disruptions, Anodot offers a robust solution—an advanced real-time monitoring dashboard designed for internal use. This dashboard empowers banks to proactively identify issues that could affect security, revenue, or customer experience, ensuring a seamless and secure banking environment. Discover how Anodot can enhance your financial business with flawless customer experience, payment optimization, and operational excellence.

5 Tools to Optimize Your Kubernetes Costs Without Sacrificing Performance

As Kubernetes environments become increasingly complex, the balance between reducing expenses and maintaining high performance is paramount. Businesses must leverage cost optimization tools to navigate this complexity without compromising on efficiency. These specialized tools provide crucial visibility into clusters, nodes, pods, and containers, allowing for precise management of resources and costs.