The latest News and Information on Monitoring for Websites, Applications, APIs, Infrastructure, and other technologies.
As organisations face outages and various security threats, monitoring an entire application platform is critical in order to determine the source of the threat or the location of the outage, as well as to verify events, logs, and traces in order to understand system behaviour at the time and take proactive and corrective actions.
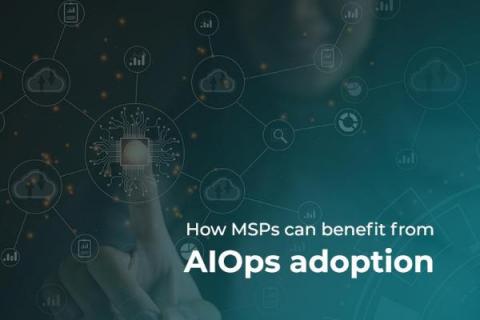
Gartner predicted, by 2020 90% of Artificial Intelligence (AI) and Machine Learning (ML) would have been deployed in enterprises through “AIOps” – a combination of machine learning and operations. An AIOps approach has the potential to reduce costs and risks by automating routine IT Operations tasks while returning more control over decisions to the organization.
As the world is trying to regain its usual pace, we at Site24x7 have been engrossed in churning out new features to help organizations enhance the health of their IT resources and meet their evolving monitoring needs. We've drafted a summary of notable features to look back on our achievements this year. We extended our monitoring capabilities for Kubernetes, network traffic, ISP latency, VMware ESXi hardware, and Mobile APM for React Native apps.
You have probably heard of Log4Shell, the security vulnerability that has ‘earned’ itself an NIST rank of 10: In this post I will show a really basic example of how this vulnerability actually works. I will walk you through some basic usage of the Log4J library and then show how some fairly basic inputs into this library can cause truly unexpected, and potentially disastrous, outcomes.
Every day the world is changing in terms of technology. A new innovation happens every second, and software and websites are becoming more and more advanced. We can now access almost every service on the internet, and software needs to be maintained as a top priority so that customer service will not get hindered. Software monitoring, however, is not an easy task. It is a 24x7 business because any user can face an issue at any time.
Grafana Tempo has had quite a year. Just eight months after it was announced at ObservabilityCON 2020, the open source tracing solution went GA. Since the Tempo team released v1.0 in June, we have ingested more than 39 trillion spans, a 26x increase from last year. We also introduced Grafana Enterprise Traces, which is powered by Tempo, to the Grafana Enterprise Stack.
Compute functions that run on Amazon’s Elastic Container Service (ECS) require regular monitoring to ensure proper running and managing of containerized functions on AWS – in short, ECS monitoring is a must. ECS can manage containers with either EC2 or Fargate compute functions. While EC2 and Fargate are compute services, EC2 allows users to configure virtually every functional aspect. Fargate is more limited in its available settings but is simpler to set up.