HEAL Software Announces SaaS Offering
Revolutionary Artificial Intelligence for IT Operations Solution Now Available as On-Demand, Cloud-Hosted Service.


The latest News and Information on Monitoring for Websites, Applications, APIs, Infrastructure, and other technologies.
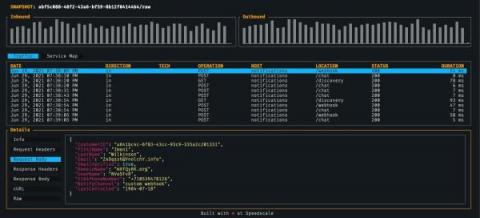
We are excited to announce the launch of Speedscale CLI, a free observability tool that inspects, detects and maps API calls on local applications or containers. The offering underscores the importance of continued and proactive API testing to quickly detect and debug defects within a shifting array of upstream and downstream interdependencies.
Chestnuts roasting on an open fire. Jack Frost turning noses blue. Yuletide carols being sung by a choir, and folks predicting twenty twenty-two.
Hopefully, you are consistently getting fresh leads and customers through your website. However, like an automobile that needs to be checked regularly for problems, you need to maintain your website for optimal performance. That's important for your search rankings, general user experience, and conversions. This guide will discuss how often you should monitor your website. We'll also look at some of the essential tasks you should take to ensure things progress nicely.
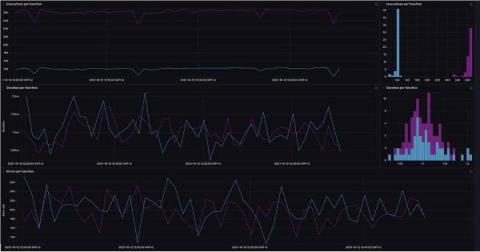
AWS Lambda is a serverless compute service that allows you to run code without having to manage servers. Lambda provides autoscaling and bills only on compute time, so you aren’t paying for unused resources. Some common use cases are file processing, stream processing, and acting as a backend for web and mobile applications. AWS Lambda functions can be invoked with external HTTP requests as well as by events triggered by over 200 different AWS services.
The overall theme is high-performing engineering teams are generally the ones that humanize the process. Whether you’re trying to increase productivity or release better-quality code, the biggest piece of advice is to lead with empathy.
Shortly before the December holidays, a vulnerability in the ubiquitous Log4J library arrived like the Grinch, Scrooge, and Krampus rolled into one monstrous bundle of Christmas misery. Log4J maintainers went to work patching the exploit, and security teams scrambled to protect millions of exposed applications before they got owned. At Cribl, we put together multiple resources to help security teams detect and prevent the Log4J vulnerability using LogStream.
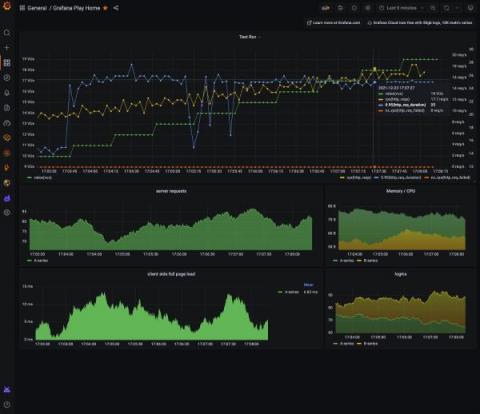
One of the common challenges when doing performance testing is the difficulty of correlating the metrics of your application with your testing results. Having available QA, infrastructure, and application metrics together allows engineering teams to better understand the behavior of their systems during the testing, helping to detect and prevent potential issues in their applications.
Monitoring is a critical part of managing a WordPress site since you need to know what's going on with it, such as how many visitors it has, how quickly it loads, and whether it's constantly online. Data on these areas will aid you in making critical decisions, resulting in improved performance, happier visitors, and, if applicable, a higher bottom line. Many factors can cause WordPress to slow down, but you don't need to be a techie to address them.