The latest News and Information on Monitoring for Websites, Applications, APIs, Infrastructure, and other technologies.
In the first of this two-part series, we covered how to set up AppSignal in a Ruby on Rails application for many great insights out of the box. AppSignal can automatically track errors, monitor performance, and report metrics about some dependencies. But, in many cases, each of our applications behaves in different ways, so we'll want more than just generic monitoring. In this post, we will run through adding custom instrumentation and monitoring to a Ruby on Rails application.
Powered by the Dart language, Flutter is one of the fastest-growing cross-platform programming frameworks in the world. Since its release in 2017 it has been empowering developers to build mobile apps that work seamlessly across iOS and Android with a single code-base. If you're a Flutter developer, you'll already know the importance of building better quality software, faster - after all, it was made for that very reason. That's why today, Raygun is proud to bring you Flutter support Crash Reporting. This highly requested release gives you complete visibility into the health of your Flutter applications, with rich diagnostics that take you to the root cause of errors and crashes.
Now that we’ve said goodbye to 2021, we are on our way to completing 20 years of IT transformation. We are taking account of every milestone, every accolade, every cheer from our users, partners, and employees to show the world what turned out to be an eventful year.
Chris Steffen is a research director for information security at Enterprise Management Associates. EMA is a leading analyst and consulting firm that prides itself on going beyond the surface to provide deep insights about the IT industry. I'm Liesse from LogDNA. Before we dive in, I just wanted to take a moment to thank all of you for tuning in to season one of DevOps State of Mind.
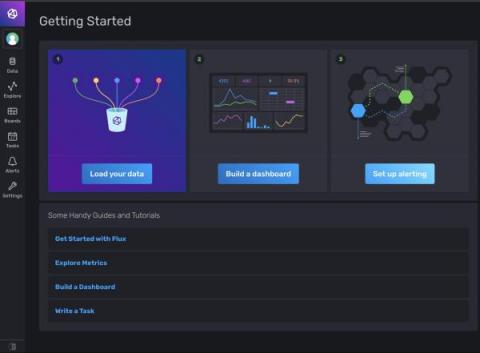
Scroll down for the author’s photo and bio. Time series databases like InfluxDB index data by time. They are efficient at recording constant data streams like server metrics, application monitoring, sensor reports, or any other data containing a timestamp. The structure makes analyzing change over time a breeze. This tutorial will show you how to set up InfluxDB with a sample Ruby application.
During.conf21, we announced the public release of the Splunk UI Toolkit, a collection of packages and libraries that provides some of the same underlying tools powering our product line to you, the Splunk developer. Now, any Splunk developer can incorporate Splunk UI components into their own custom applications and tools. This includes everything from buttons and inputs from our @splunk/react-ui package, or our new parallel coordinates visualization from our @splunk/visualizations package.
What comes first – observability or AIOps? Can you achieve observability without AIOps? Do you need AIOps if you already have an observability solution in place? These are all questions that any team considering AIOps will want to answer in order to determine the real-world value that AIOps tools stand to offer.
Government data strategies lay a promising groundwork for how data will be used to drive more informed decision making internally and more streamlined public services externally. A commonality between these strategies is the need for improved role-based data sharing and data re-use. The sticking point, however, is in the way to implement data sharing when there are known silos across and within various departments.
With the Elastic 7.16 release, Osquery Manager is now generally available for Elastic Agent, making it easier than ever to deploy and run Osquery across your environments. By collecting Osquery data and combining it with the power of the Elastic Stack, you can greatly expand your endpoint telemetry, enabling enhanced detection and investigation, and improved hunting for vulnerabilities and anomalous activities.