Releasing Icinga 2.13.0
Today we’re releasing our next major version of Icinga 2. Icinga 2.13 includes many long awaited enhancements and bug fixes, but also a lot of smaller changes.


The latest News and Information on Monitoring for Websites, Applications, APIs, Infrastructure, and other technologies.
Today we’re releasing our next major version of Icinga 2. Icinga 2.13 includes many long awaited enhancements and bug fixes, but also a lot of smaller changes.
Elastic Security's newest features define the potential of XDR for cybersecurity teams. Our single platform brings together SIEM and endpoint security, allowing users to ingest and retain large volumes of data from diverse sources, store and search data for longer, and augment threat hunting with detections and machine learning. Security vendors are using the term “XDR” with increasing frequency, applying varied definitions to suit their respective technologies.
We are pleased to announce the general availability (GA) of Elastic 7.14, including our Elastic Enterprise Search, Observability, and Security solutions, which are built into the Elastic Stack — Elasticsearch and Kibana. Elastic 7.14 empowers organizations with the first free and open Limitless XDR, which delivers unified SIEM and endpoint security capabilities in one platform.
For many CSPs, increasingly complex networks and immature technological solutions result in a typically long time to the detection and resolution of incidents that impact the customer experience, the brand’s reputation, and the bottom line. With RAN, Mobile and IP core, transport and applications and dozens of other integrated components, the network is one of the most complex areas to monitor.
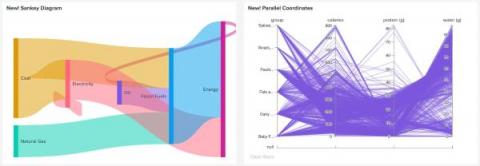
Here on the Splunk Dashboards team we take your feedback seriously. While we can't get to every request right away, we do add most requests to the backlog so we can roll your feedback into the product. In this blog post, we'll cover new features and improvements to Dashboard Studio in Splunk Cloud Platform 8.2.2106 based on feedback from you, our customers.
Website uptime monitoring is exactly what it sounds like; a service that monitors your website from the countries you’ve selected, to see if it is up and running. This saves you the stress of having to constantly use your resource to check for any downtime, or individual errors/issues, or run the risk of your customers telling you it’s down. The best part about uptime monitoring is that you can choose how often you’d like your site to be monitored.
Intermittent network problems frustrate users, affect productivity levels, overwhelm your IT team, and are a pain for network administrators to solve. There are many problems that can affect network performance, and some of them are very complex to identify and understand. To help you proactively identify network problems that may be plaguing your network, we’re running you through some of the most common network problems!
In recent days web application has become a vital part of our day-to-day life. We often don’t understand the technology behind an application as how it works, what type of programming languages have been used or what kind of databases are used to store and retrieve data. But when you try to create one such application you should definitely know how to build an application and the technology stack behind it.
Application Performance Management is all about gaining a complete picture of your applications' inner workings so you can make sure they're performing as they should. APM tools make it easier for developers to spot issues that are preventing their applications from providing outstanding user experiences. Furthermore, these monitoring services can help to limit the danger of fatal outages and downtime, which can be extremely costly for any company.