Operations | Monitoring | ITSM | DevOps | Cloud

The latest News and Information on Monitoring for Websites, Applications, APIs, Infrastructure, and other technologies.

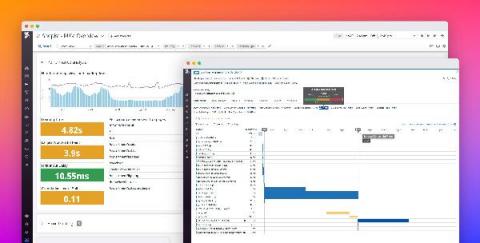
Monitor Core Web Vitals with Datadog RUM and Synthetic Monitoring

In May 2020, Google introduced Core Web Vitals, a set of three metrics that serve as the gold standard for monitoring a site’s UX performance. These metrics, which focus on load performance, interactivity, and visual stability, simplify UX metric collection by signaling which frontend performance indicators matter the most.


How to Monitor Google Network Performance: Google Meet, Google Workspace, Gmail and Google Calendar

Application slowdowns, poor Internet speed, and laggy video calls are always frustrating. Whether you’re working in an office, or working from home, it’s important to keep an eye on the applications that matter most. In this article, we’re teaching you how to monitor the network performance of Google apps, including Google Meet, Google Workspace, Gmail & Google Calendar.

RapidSpike Turns 6

Picture the scene. It’s 9am on a cold, wet, January Sunday morning in 2015 and I’m trudging up Merrion Street in Leeds. Recently made redundant, I’m on my way to a coffee shop that I’m desperately hoping is open. Am I a coffee aficionado desperate for a fix? Am I getting pumped for a gym session? Do I just enjoy walks in the rain? No. I’m on my way to a job interview.

5 DevOps best practices to reinforce with monitoring tools

As part of a modern software development team, you’re asked to do a lot. You’re supposed to build faster, release more frequently, crush bugs, and integrate testing suites along the way. You’re supposed to implement and practice a strong DevOps culture, read entire novels about SRE best practices, go agile, or add a bunch of Scrum ceremonies to everyone’s calendar.

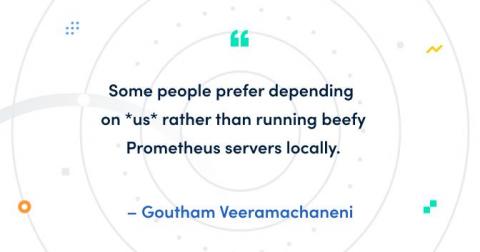
The 3 major benefits that Grafana Cloud customers get from our hosted Prometheus service

Grafana Cloud is the easiest way to get what you need for observability: Prometheus and Graphite for metrics, Loki for logs, and Tempo for tracing, all integrated within Grafana and managed by the Grafana Labs team. You can go from zero to beautiful graphs, insightful logs, and preconfigured alerts in minutes. Built with modern distributed systems techniques, Grafana Cloud allows you to grow with your applications and infrastructure and easily scale past 100M+ metrics.

Martello Featured | Industry Recognition

The primary goal of our solutions is to help companies achieve specific business goals; whether that’s maintaining and improving the user experience and overall productivity, gaining valuable insight from enhanced visibility into your organization’s IT infrastructure, developing proactive strategies that mitigate the impact of service interruptions or issues, or all of the above, Martello is proud of the products and services we are able to provide.