Operations | Monitoring | ITSM | DevOps | Cloud

Introducing... Splunk for iPad!

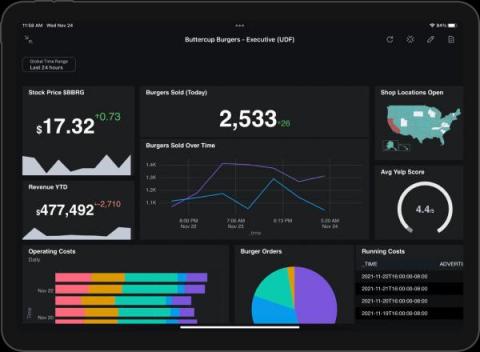
Are you busy and on the go but still need to dig into your data and view your dashboards? We’ve got you covered — introducing… Splunk for iPad! Splunk for iPad is designed for and dedicated to what’s unique and great about the iPad, taking full advantage of its portable and interactive nature with unique dashboard annotation and note-taking features.

Performance Testing Tools: 8 to Help Find Your Bottlenecks

Performance is a vital component of user experience. Users will leave—and likely not come back—if your site is slow. If they stay, they’ll be less likely to buy from you if their experience is subpar. To add insult to injury, they’re even less likely to find your app to begin with, since Google punishes poorly-performing sites in the search results. To solve the problem of poor performance, knowledge of what impacts performance is essential.

Announcing the GA of Splunk APM's AlwaysOn Profiling

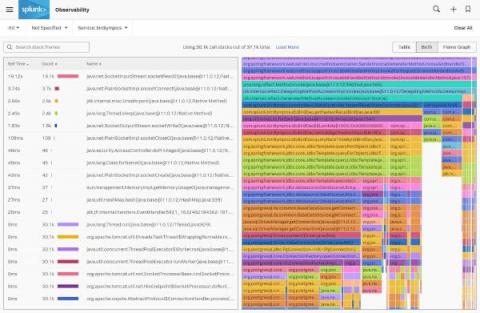
As an update to.conf’s announcement of our continuous code profiling preview, we’re excited to share that today Splunk APM’s AlwaysOn Profiling is generally available for Java applications, included in APM with no additional cost. Here’s a quick walkthrough of the feature, and how you can get started now.

How to Deploy the Splunk OpenTelemetry Collector to Gather Kubernetes Metrics

With Kubernetes emerging as a strong choice for container orchestration for many organizations, monitoring in Kubernetes environments is essential to application performance. Kubernetes allows developers to develop applications using distributed microservices introducing new challenges not present with traditional monolithic environments. Understanding your microservices environment requires understanding how requests traverse between different layers of the stack and across multiple services.

Monitor Salesforce's Real-Time Events with Splunk

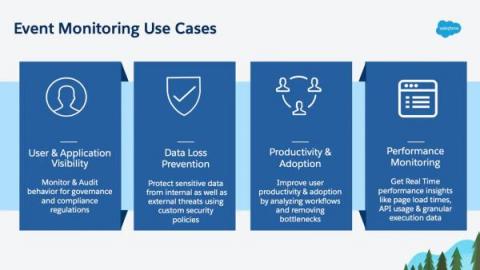
In 2019 Salesforce announced the general availability of Real-Time Event Monitoring (RTEM) which includes 19 different events that help monitor & secure your Salesforce data. Real-Time Event Monitoring stores events for 6 months as Salesforce Big Objects and streams events via Salesforce’s Streaming API in near real-time.

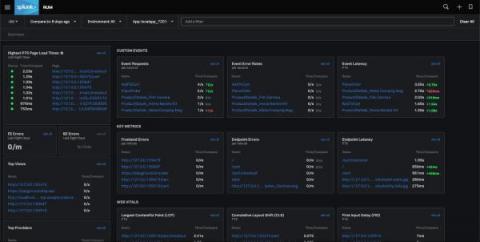
Announcing the General Availability of Splunk RUM Custom Events

With a 70% increase in internet usage, and digital teams adopting cloud-native technologies at a rapid rate, the importance of measuring customer experience on digital properties is not just a technical problem, but a business imperative. Frontend developers and SREs use Real User Monitoring (RUM) to understand critical components of their end-user experience, like how quickly users see content, when a page becomes interactive, and a page's visual stability.

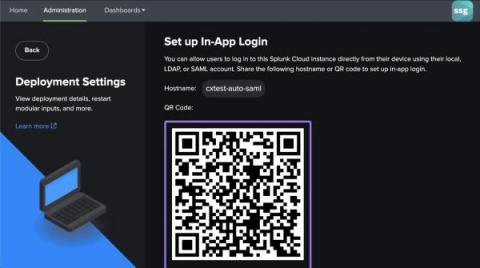
Logging into your Connected Experiences

After checking out the Get Started with Connected Experiences blog, you’ll be an expert on 1) how your Splunk data gets to mobile, (2) how to unlock mobile for your Splunk instance, and (3) how user management works. So, with this blog, I’d say it’s time to talk about the many login methods users can leverage with their Splunk instance on mobile.

Splunking Your *.conf Files: How to Audit Configuration Changes Like a Boss

For years customers have leveraged the power of Splunk configuration files to customize their environments with flexibility and precision. And for years, we’ve enabled admins to customize things like system settings, deployment configurations, knowledge objects and saved searches to their hearts’ content. Unfortunately a side effect of this was that multiple team members could change underlying.conf files and forget that those changes ever occurred.