Operations | Monitoring | ITSM | DevOps | Cloud

Latest News

Uptime and Response Time Graphs

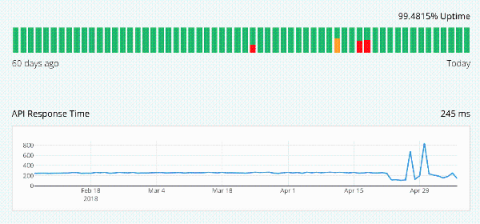
As one of the most requested features we are happy to officially introduce the Uptime and Response time graphs. Setting up an uptime graph requires zero configuration, it’ll be added automatically to your status page (for startup & business subscribers) and you can choose to hide it in the design page of your admin panel.

Empowering Help Desk Professionals to Proactively Solve End User Problems

Help desk technicians form the front line of support in identifying, troubleshooting, and preventing end user performance issues (and costly downtime) for key applications and services. They need to quickly identify the scope of the issue and route the critical details required to fix the issue – fast. Goliath Technologies increases the troubleshooting and remediation abilities of help desk technicians by placing a vast array of tools at their fingertips.

We've come a long way together ... Icinga turns 9

Born to be wild. We’ve been busy with bringing Elasticstack integration into full shape with the Icinga 2 feature and the corresponding Icinga Web 2 module. Both of them were thankfully funded and sponsored by VW. Elasticsearch 6 support is sponsored by a customer too, this will hit 2.9 later in June. Earlier in 2017 we’ve also released the Logstash output for Icinga.

PagerDuty Helps Microsoft Azure and Visual Studio Customers Manage Incidents in Real Time and Migrate Confidently to the Cloud

SAN FRANCISCO – May 7, 2018 – Today at Microsoft Build 2018, PagerDuty, a global leader in digital operations management, announced integration of PagerDuty’s real-time operations management platform with Microsoft Azure and Visual Studio Team Services, Azure’s integrated suite of DevOps services.

Combining Log Analysis with Continuous Delivery to Reduce Release Cycle Times

One of the biggest challenges in the field of log analysis is being able to connect the dots and understand the underlying story connecting them. Applications and machines are generating an increasing amount of log data, making it extremely difficult to separate the wheat from the chaff.

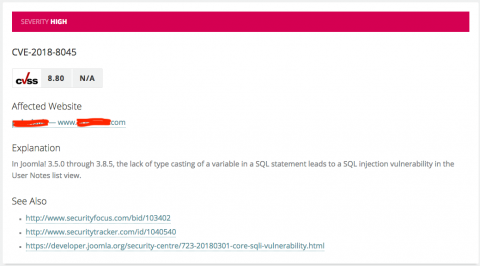
Joomla! CMS Vulnerability Scanner

WordPress may power the majority or the internet, but Joomla! is the second most popular CMS on the planet, representing 6.1% of all known CMS websites. So we felt it was important to integrate it directly into our external website security and vulnerability scanner. Sitting alongside special checks for WordPress, Drupal and SilverStripe websites, we scan potential issues with the core version of Joomla! and any plugins installed.

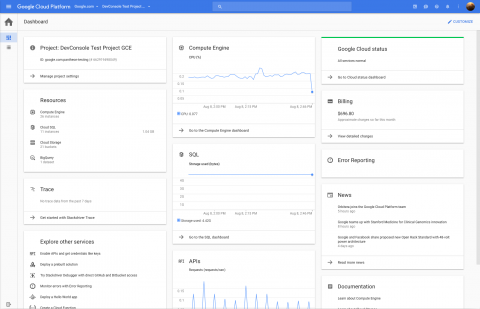
Announcing Stackdriver Kubernetes Monitoring: Comprehensive Kubernetes observability from the start

Today, we are excited to announce the beta release of Stackdriver Kubernetes Monitoring, which lets you observe Kubernetes in a comprehensive fashion, simplifying operations for both developers and operators.