Operations | Monitoring | ITSM | DevOps | Cloud

Logging

The latest News and Information on Log Management, Log Analytics and related technologies.

Detecting Malware and Watering Hole Attacks with Splunk UBA

You may be surprised to learn that a particular malware is responsible for data theft in over 20% of financial institutions and other verticals in 2019. Watering hole attacks involve a web server that hosts files or applications where the website or files on the site become weaponized with malware. While recent news cycles have shined a spotlight on ransomware and crimeware, malware is not a new concept.

Protect Your AWS Infrastructure with GuardDuty and Coralogix

Cloud environments like AWS can be a challenge for security monitoring services to operate in since assets tend to dynamically appear and disappear. Making matters more challenging, some asset identifiers that are stable in traditional IT environments like IP addresses are less reliable due to their transient behavior in a cloud service like AWS. Amazon GuardDuty protects your AWS environment with intelligent threat detection and continuous monitoring.

How to use Kibana effectively. Today: Detect possible frauds in your data

Kibana is quite powerful and versatile for visualizing data in Elasticsearch. The Elastic Stack can be used for a variety of use cases. One is the detection of frauds e.g. in Banking transaction like within Softbank Payment Service or bonus point accounts like within Miles and More. Other areas are insurance or tax return data.

Introduction to Kibana Best Practices for Log Search and Visualizations

Kibana is a powerful and flexible tool to search and visualize your logs in Elasticsearch – but only if you know how to use it! Zach Hamilton, a Sales Engineer at Logz.io, has enabled hundreds to be successful with Kibana and will provide his insights for best practices in this webinar. Understanding Kibana’s strengths and quirks can help you more efficiently explore your log data so you can quickly understand what’s happening in your environment.

Gaining Visibility Into Edge Computing with Kubernetes & Better Monitoring

Edge computing is likely the most interesting section of the broader world of IoT. If IoT is about connecting all the devices to the Internet, edge computing is about giving more processing power to devices at the edge. Edge computing views these edge devices as mini clouds or mini data centers. They each have their own mini servers, mini networking, mini storage, apps running on top of this infrastructure, and endpoint devices.

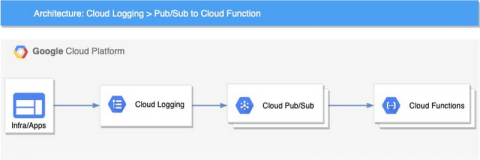
Detecting and responding to Cloud Logging events in real-time

Logging is a critical component of your cloud infrastructure and provides valuable insight into the performance of your systems and applications. On Google Cloud, Cloud Logging is a service that allows you to store, search, monitor, and alert on log data and events from your Google Cloud Platform (GCP) infrastructure services and your applications. You can view and analyze log data in real time via Logs Viewer, command line or Cloud SDK.

Automating Security on Your Observability Platform: Cortex XSOAR & Logz.io

Managing a complex microservice-based architecture requires defending multiple endpoints. Automating security covers a vast amount of tools and methodologies, so making sure they all communicate is critical. Additionally, tool sprawl in any aspect of DevOps requires putting automation to good use. The Logz.io Cloud SIEM focuses on identifying threats. To optimize its effectiveness, we have negotiated and built out multiple integrations tying complementary tools together.

Why does Elastic Support keeping asking for diagnostic files?

If you’ve worked with Elastic Support, you may have been asked to run the Support Diagnostic tool and provide the output in your support case. This is a common practice, but a lot of you out there may not know why. While the short answer is "it depends", this blog is going to explain why we keep asking for diagnostic files (as well as what’s in them). Simply put, the Support Diagnostic helps Elastic Support understand the state of your cluster.